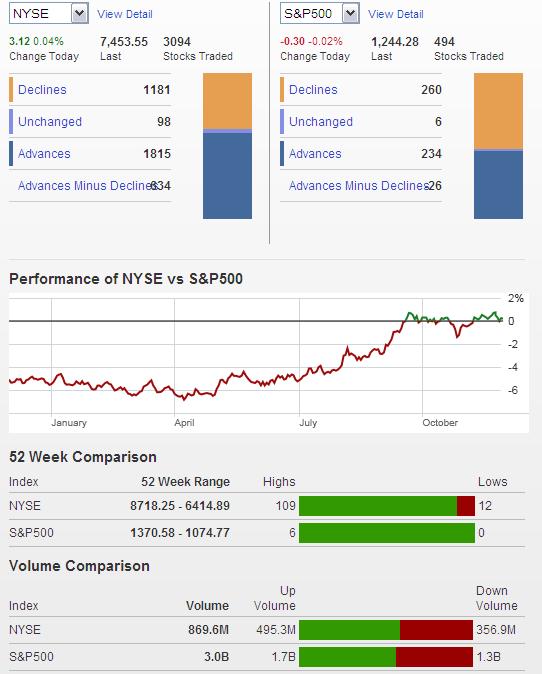
I was hoping by now the market would be tanking hard as projected and I could give my A-Team Hannibal line of how "I love it when a plan comes together." But unfortunately, I can't. I'm not putting much emphasis on the market's internals until after the New Year since volume should be light the rest of the month and there's usually a positive bias right now. You can see that today's 800 million NYSE shares shows you exactly what I mean. The interesting note here is that volume was slightly tilted to the negative side, despite the Dow posting a decent gain of 52 points at the close. When you combine this weak internal structure of the rally today to the wave count and daily bars I discuss below, it tells us that at least a short term top might be nearby. If nothing else, it's a great risk/reward opportunity for the bears since the retracement is so deep and has now come closer to my stop level just above 1277.55.
Single- and Multi-Bar Price Analysis: Could It Help You Forecast the Markets?

One reason I still hold this count as top choice though is that the rally involved governmental interference. This may interupt the short term gyrations and wave count in the market, but it won't prevent the original larger trend from taking over in the end. So the two guidelines I mentioned in the previous paragraph have more forgiveness on my part since the wave had government intervention in it. I know that many wavers disagree with me when I say that external events such as government intervention have an impact on the wave the count at level, but this is just my opinion developed over the past several years of using EWP. I don't think external influences, such as government intervention, can change the long term trend, I just think it can complicate the short term wave count at times.
If the above count is correct, the market will stay capped at 1277.55. A move above this level probably means Intermediate wave (2) is not finished and that I'm going to step aside until I see signs of a top again.
One thing to note as we move forward in the coming days. Looking at the recent rally which I labeled wave (ii), it looks impulsive on the daily chart above. This of course would mean the labeling in my chart is wrong and that the larger trend is now actually up. There are some candlesticks with large wicks on the daily charts that have formed the past few trading session which suggest there is strong resistance at current levels so at least a short term pullback is likely coming. The reason I wanted to mention all this is because we may get some weakness this week but it MAY not be because the downtrend has resumed but actually just a correction of a 5 wave rally. So it will be important to get a good definitive wave count on the decline to determine if the decline is impulsive or corrective so we'll have more certainty as to the larger trend.
So a lot of "ifs" and "buts" today which is unfortante. But I try to just write these posts as objective as possible with all the relavent thoughts I have on the market at the time. And ufnortunately, the past few days has left some uncertainty. So managing risk, not maximizing profits, is paramount for me this week.

The euro has obeyed my forecast from last week...........wow, I like how that sounds, it "obeyed my forecast".........anyway, it fell lower after that big reversal candlestick on the 4hr chart I pointed out in last post. However it has been a bit flat since the initial drop. Nothing concerning at this point for the bears at this point though, but I'd like to see the euro sell off in the near future to be more comfortable with assuming a top is in.
Download Your Free Price Bars and Chart Patterns Trading eBook

The euro is consolidating on the one hour timeframe. This means that there is probably going to be a breakout pretty soon, i.e. a sharp and deep move. Since the euro is not giving us a high confidence wave count, I'm not sure how a consolidation or a triangle would fit in here, and therefore I can't be confident in what direction it will breakout to. But since it's made a lower high and lower low recently, it could be the start of another major downtrend phase, so I'm not abandoning the bearish outlook due to this currnet triangle like pattern. I'm just ensuring my stops are in place at comfortable levels because if this thing breaks out against me I want to make sure I'm removed from this market as soon as possible.
The bottom line is that I remain short but have tightened my stop in preparation for the breakout possibly going against me.
Learn Elliott Wave Principle (EWP)
PLEASE NOTE: THIS IS JUST AN ANALYSIS BLOG AND IN NO WAY GUARANTEES OR IMPLIES ANY PROFIT OR GAIN. THE DATA HERE IS MERELY AN EXPRESSED OPINION. TRADE AT YOUR OWN RISK.