Saturday, November 14, 2009

Current Market Behavior is Similar to the 2007 Top


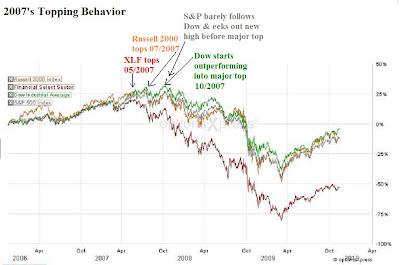
I think it's important to illustrate with charts my thesis about how important it is that the Dow is surging higher to new highs while other indices and sectors are lagging behind. Let's study the two index/sector comparision charts attached:

First, look at the structure of these markets during the 2007 topping process. Notice that the XLF made its 2007 top in May, the Russell 2000 made its top in July, and the Dow and S&P topped in October. So the XLF and Russell started their bear market declines months before the Dow and S&P did. Then, also notice that prior to these tops, all the markets were running up quite closely together as you can see how bunched up they were at that time. But then the XLF falls off and separates in May, then the Russell peels away in July, and then the Dow surges higher to new highs separating higher, dragging the S&P along with it until finally they all give way and start their big bear market declines in October.

Second, now look at the current 1 month chart of the same markets. This time the Russell 2000 topped in September, the XLF topped in October, and they are again lagging badly from the S&P and Dow. In addition to that, the Dow is surging higher again, separating even further from the XLF and Russell just as it did into the 2007 top. So you can see that the stock market's behavior today, is similar to its behavior in 2007 when formed a major top that led to the largest selloff since the Great Depression.

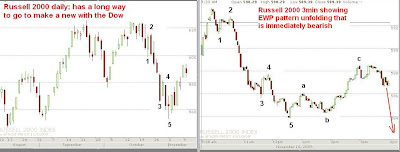
Lastly, another piece of evidence that the Russell 2000 and XLF have topped is their wave counts and structure. Look at the 30min XLF chart attached. It clearly declined in 5 waves from its October high, is sporting a classic topping head and shoulders pattern (not shown), and after its intial 5 wave decline it made a 3 wave rally which is corrective and counter trend. Following that 3 wave rally labeled a-b-c of (2), we now have a 5 wave decline from the wave (2) high, suggesting that the XLF is starting its next leg down. The count and structure is similar in the Russell 2000.

So it seems clear to me that the market is in a major topping process as long as the highs in the Russell 2000 and XLF hold, and is sporting similar behavior to its 2007 top. In 2007, the XLF topped about 5 months prior to the S&P and the Russell topped 3 months prior. So it's possible this may happen again now, meaning the S&P won't top until December 2009 to February 2010. Although I'm not sure this market has enough strength to get that high at this point, and the forces of wave 3 or C will be quite stronger than the 2007 top.

Since the XLF and Russell 2000 are leading the way, I'll be watching them to hint that wave 3 or C in the S&P is underway. I'm looking for a break of the Russell and XLF's November 2nd's lows to signal the next round of selling and that I can try again to call "the top". If Monday morning we get a nice rally again to new S&P/Dow highs, I will probably close my short term call option positions at a profit and sit only on my long term put option positions (QQQQ, XLF, IWM, SPY, SLV) because short term behavior and structure suggests another declining phase fast approaching, especially because volume has been absolutely dissipating on the recent rally leg.


PLEASE NOTE: THIS IS JUST AN ANALYSIS BLOG AND IN NO WAY GUARANTEES OR IMPLIES ANY PROFIT OR GAIN. THE DATA HERE IS MERELY AN EXPRESSED OPINION. TRADE AT YOUR OWN RISK.

Friday, November 13, 2009

Friday Morning Update


PLEASE NOTE THAT I'VE UPDATED MY "LONG TERM S&P FUTURES CHART" ON THE RIGHT SIDE OF THE BLOG.

So the stock market surged this morning.....or did it? Again, the Dow is the one on fire, yet the stragglers are becoming more pronounced here. Currently the Dow is up .80% at the time of writing, but the S&P is up .63%, the Nasdaq Composite only .56%, the Russell 2000 only .47% and the XLF is actually DOWN .14%. Again, the Dow seems to be "running the wrong" way, and only a small handful of stocks are dragging the rest of the market mildly higher. Yet these gains are becoming harder and harder to obtain. NYSE internals are nothing stellar for such a big Dow rally with 2.26 stock trading higher for every one stock trading down. This again supports the thesis that only a handful of stocks are dragging this market higher. This doesn't mean a top is in, not at all, the market can slug along for days/weeks. But this type of behavior is part of the topping process that will snap back hard to the downside once it's done.

Yesterday's post illustrated the structures in the Russell 2000 and the XLF (financials ETF) and showed a very bearish picture and possible reversal yesterday which may lead to their next leg down. Both of them have not come close to exceeding their daily highs like the Dow, S&P and Nasdaq 100 did. Yesterday the Russell 2000 was down about 2%, much greater than the other indices just mentioned, and today it's up only half of what the Dow is percentage wise. So the Russell is really dragging. It's too early to confirm this, but I'm starting to think that the XLF and Russell 2000 have already topped and reversed in their wave 3 or C back in September 23rd for the Russell and October 14th for the XLF. This is classic behavior for large topping action. Some indices charge higher and higher while other indices and sectors lag, and some start their bear markets earlier than the main indices. That's occuring right now and we need to pay close attention to it.

With that said though, looking at the very short term (15 minute chart) S&P cash pattern, it looks a lot like a 3 wave downward correction completed from yesterday, an ABC zig-zag which I labeled in the attached chart as my "Top Count". This suggests new highs for both the Dow and S&P in the near future. From there, I'll have to assess what happens. But with the XLF and Russell 2000 sporting those big reversal patterns yesterday and then dragging big time today, I'm not sure they will follow the Dow and S&P to new highs from this week, which means a new high in the Dow and S&P would probably be short lived. The other alternate count is that the decline from yesterday is a series of 1s and 2s to the downside (see attached chart). It's not wise to count a series of 1s and 2s without solid supporting evidence as your primary count so that's why this is my alternate right now. A break of 1085 in the S&P would make this count my "Top Count".

As I watch the erradic short term movements of this market I continue to focus on the "Long Term S&P Futures Chart" on the right side of my blog in order to keep perspective on the bigger picture. The short term may fool me many times, but the long term is clear.

Thursday, November 12, 2009

Significant Bearish Action in Precious Metals Today - Could be Stock Market Indicator


After my last post I went meandering through dollar charts and stumbled about gold and silver charts which I loosely follow. After looking at them for a few minutes a siren went off. The action in the metals is extremely bearish right now. On the daily charts it shows reversal patterns in both gold and silver, with silver being the most glaring. Silver rallied today higher than yesterday's high, then closed beneath yesterday's low. This is a very significant and reliable bearish reversal pattern. This is very problematic for gold bulls because gold has made a signficant daily high that silver hasn't followed. If silver is in fact reversing, then it will leave in place a big bearish divergence between the metals which usually happens at major tops. Also notice on the gold chart that the RSI has gone into overbought territory and then under it 5 times in the timeframe shown, and 4 of those times led to signficiant gold tops and declines.

This is very significant to our overall outlook of the stock market and the dollar. Although not confirmed, the EUR/USD appears that it may have formed a major top and has reversed back to its downtrend (this means the US dollar has bottomed). Seeing as that the EUR/USD has a high positive correlation to gold, then if gold and silver have topped, it means that the EUR/USD has probably topped. If the EUR/USD has topped, then the stock market might have topped. Are you seeing the connection here, and what this gold and silver data may mean? Remember that the US dollar's continued descent seems key to the stock market's rally. If the dollar has formed a major bottom, then the stock market should form a major top.

I'm by no means calling "the top" in now, it's still too soon. But it's quite possible this top may just sneak up on us, catching us off guard and beaten up after taking out our stop at the 1101 level. Like I said, the market will make it extremely difficult to catch this huge wave 3 or C, so we can't get complacent. Nothing is confirmed as of yet by any means, but these are things to look for and to see if they develop into something significant in the future here as we do look for a stock market top. So I'm still short term neutral on the stock market, waiting for confirmation.

Market Remains Fractured, Laboring Greatly


The market sold off today, which is what it "should" have done yesterday after that Dow/NYSE signal executed on Tuesday. But hey, the market does what it wants when it wants. Internals were weak today with the NYSE having over 83% of volume to the downside and having 3.8 declining stocks for every one trading up. The S&P 500 had only 58 stocks close higher today. So the internals were very weak, and lack of buying conviction is becomeing quite evident. However volume was weak today though, about the same as it has been the past couple days.

It's too early to try and call "the top" in place in the market, although there are some encouraging signs that it's possible. The S&P made a double top just above the 1100 area, showing that traders aren't convinced of follow through above that level and are taking profits there. That appears to be a key level. Also, several indices and securities made nice bearish reversal candlestick formations as you can see from my attached charts. In addition, the EUR/USD (which seems to be leading the stock market) formed a nice head and shoulders pattern on the 1 hour chart and is charging towards key support at 1.4800. A break of that level will be a signal that the pair might have topped (and the US dollar has bottomed), and a break of 1.4620 will confirm that a EUR/USD top is in place, and open the door greatly to the fact that the stock market may have topped at that time as well. One more thing, notice the daily VIX chart attached where you see a bullish candlestick formation with a "hammer" followed by a strong rally candle. A VIX rally would most likely mean a stock market decline, and the VIX looks like it's formed some degree of bottom and rally reversal at this time.

As of right now, in order for me to call "the top" to wave 2 or B, I'd like to see the current market leaders like the Russell 2000 and the XLF break their November 2nd lows. The Russell 2000 has especially been a good predictor of the overall market's future movement, so a break of 553.31 would be a big glaring sign that wave 3 or C is underway and the overall market has formed "the top".

So that's essentially where I feel we're at. The market is extremely fractured, i.e. gold and silver are diverging greatly, a few indices made new daily highs while others have not, only a handful of stocks are leading this market higher, internals of the market show a lack of buying conviction, and the past two sell off and rally phases were met with high volume on selling and low volume on buying. So it appears buyers are fleeing, and starting to dissipate. So the topping formation continues, and I'm waiting for some king of confirmation of "the top", which might occur when the EUR/USD breaks 1.4620 AND the Russell 2000 and XLF break their November 2nd lows.

Morning Update


Please note that I modified my "Long Term S&P Futures Chart" on the right of this blog. Also a quick clarification, yesterday I said that all the main indices confirmed the Dow's new high, but this was only for the S&P and Nasdaq 100, the Nasdaq Composite dit not make a new high.

I just wanted to drop a note on what I see this morning. There are a few things to take note so far:

1) the internals are fairly weak on the NYSE which has been the trend the past few days. This is important because it shows a lack of confidence in the rally at this point, and also contributes to the "fractured market" thesis I've been talking about in past posts where only a small handfull of stocks are leading the overall market higher.

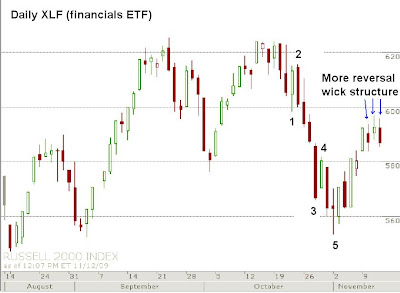
2) the Russell 2000 and the XLF are both well beneath their daily highs and are forming reversal patterns so far. You can see on my attached charts that there is a lot of selling pressure at near current levels by the medium length candle wicks. A strong close beneath yesterday's close would be a good signal that a reversal at some degree has occurred.

3) the dollar is on fire since yesterday. The EUR/USD is considered the "anti-dollar" because it basically moves opposite the US Dollar Index. Because of that, it means the EUR/USD should follow the stock market fairly well, since the stock market has been moving opposite the dollar. The EUR/USD has rallied in 5 waves, but did not make a new daily high, so that's concerning to the short term bearish case for the EUR/USD. However, the decline from its high is quite fast and ferocious so we should pay close attention. A break of 1.4800 will be a good start to calling a major top and reversal, and a break beneath 1.4620 will confirm a EUR/USD top and US dollar bottom is in place for a long time.

So that's what I noticed this morning that was worth announcing. This can all change as the day wears on, but this is what I'm watching at the moment.

More later.

Wednesday, November 11, 2009

1101 Broken in the S&P; I'm Waiting to re-Short on Weakness


My sincere apologies to you all for posting so late on a very important day. I have not been feeling well this morning, either due to the Thai Chicken I had last night or because I saw the S&P broke above 1101 today. I'm still not feeling well so I'm just going to run off some things I think are important for today:

I share in everyone's frustration today in seeing the S&P give us yet another fakeout, and making a new high. I solidly believed that 1101 would hold for a long long time. I was clearly wrong. However, with that said, the long term bearish case is still well intact as long as the S&P trades beneath 1576. Obviously that doesn't do traders much good, but I'm saying it so I don't lose sight of the bigger picture just because I was wrong on the short term picture. The composition of this market rally is that of a correction, a bear market rally, i.e. declining volume, choppy overlapping waves, optimism extremely high after only retracing 50% of the previous decline, and the fact that the rally followed a clear 5 waves down from the 2007 lows. This all tells us that the 1576 S&P cash level will hold, and that 666 will be broken in the coming months. The extremely challenging task has been to "call the top", and assessing the short term structure.

With that said, the market remains very fractured, and although the main indices confirmed the Dow's new daily high today, the Russell 2000, XLF, NYSE and Dow Transports and Utilities still have not. So what I said yesterday still holds, the Dow is "running the wrong way" and it appears the S&P and Nasdaqs are just slowly peetering along for the moment. Keep in mind that the Dow only has 30 stocks in it, so a 30 stock index is leading a stock market that is composed of over 5000 stocks. You can also see that the last two rallies to new highs in the S&P have been done so on declining volume from the previous declines (see attached chart). So the masses come in and sell, and a small amount of bulls trading a small amount of stocks, push this market up higher. This is classic topping behavior.

So there you have it; I was wrong on the short term picture but still remain bearish on the market, with the same positions in that I had all week. With no clear signs of a top in place right now, and no real stop loss level clearly defined, I do not want to make a short term bear call right now. So right now I'm short term neutral as far as forecasting goes. My plan is to let the market play out in the coming days and wait for weakness to return again. When it does, you can be sure I'll be here again, pounding the table making the case for the best positions I see available.

Tuesday, November 10, 2009

NYSE/DOW Sell Signal Given; Overall Market Very Fractured - Unhealthy


BEFORE PLAYING THE VIDEO, PLEASE READ FIRST PARAGRAPH:

The market remains fractured and the Dow Industrials continue to churn higher like the little engine that could, only that many other important indices and sectors are not following its bull run, like the Transports, Utilities, Russell 2000, and the XLF who are all severely lagging and are unfolding in very corrective looking patterns. Silver also sold off more than 2% intraday, again severely lagging gold and indicating risk aversion is brewing underneath the overall market. It's as if the Dow is "running the wrong way", and everyone knows it but the Dow, as the other indices are just sitting their watching in disbelief of the Dow's charge higher. Okay, now watch the embedded American football video........the player in the clip is my analogy of the Dow, and the other players are the other indices.

">

It appears the reason for this "fracturing" is that money is shifting around, but it's shifting into only a small amount of securities, mainly in the Dow and gold. This is not healthy, and signals a severe exhaustion of trend; a trend that has lasted since March of 2009.

So to illustrate this fractured nature of the market and to keep your eyes on the overall market, and not just the headline Dow number:

1) I posted the NYSE internals data showing that there was a solid more amount of sellers than buyers today, and about 56% of the volume was to the downside. Hardly a great case for the bulls after such a huge day yesterday.

2) Notice that the NYSE closed down today, yet the Dow closed up. Some of you may remember that this signal in the past has predicted huge selloffs the next day, and that held true when I announced it October 27th (click here for the actual post). The next day the S&P sold off 19 points (click here for the actual post). We'll see if another big selloff occurs tomorrow in light of this NYSE/Dow sell signal.

3) As I mentioned this morning, the Russell 2000, which is a great risk measurer because it has all small caps in it, has appeared to have completed its correction, declined in 5 waves today, and is far far away from making a new daily high with the Dow.

4) The financials, the DJ Transports and Utilities did not come close to making new daily highs either. Nor did any major index make a new daily high for that matter.

5) Silver is also another great "risk barometer". When people start to get scared, or have less of a risk appettite, they sell their higher risk assets, like silver, small cap stocks, technology stocks, etc. Silver's weakness, especially in comparison to gold lately is a warning sign.

Are you picking up the analogy of the Dow and that American football player running the wrong way yet? It seems that everything in the stock market is so bullish, and the Dow is soaring, making headlines bringing euphoria back to the market. But when you dig down deep into the overall stock market, you see that the Dow is alone in this endeavor at the moment.

DOLLAR

The other key measure, the dollar, made some mild progress today and last night showed some big strength. It still remains above its lows made against the euro and chf, so the bullish path is still on track.

SUMMARY

So the bearish case was severely weakened yesterday, but today it's made some progress, and the fractured nature of the market, along with the Russell's 5 wave decline, and the NYSE/Dow sell signal in place, it's possible that tomorrow will be a big selloff. The mere fact that the Dow Industrials made a new daily high and the other indices did not, with some severely lagging, is very bearish as long as it holds. The only kink in the armor is that it's Veteran's Day tomorrow so volume will probably be light and it may throw a wrench in things. Regardless of the short term action, the market is clearly sending a signal that it is fractured, hobbling, and unhealthy. I remain short term bearish against S&P 1101 and long term bearish against 1576. I made no trades today and my long term puts and small short term call positions remain in place.

Russell 2000 Just Printed a 5 Wave Decline


The Russell 2000 and it's basket of high risk small cap stocks has proved to be a great predictor of future movement for the overall market as it has been ahead of moves the past several days. This morning it just completed a small 5 wave decline from the top of what appears to be a WXY correction. Counting the rally in the Russell as 5 waves, and therefore signaling that a new uptrend has started, is very difficult and it counts much better as a countertrend move, a corrective WXY. Small time frames are not that reliable, but since today is so important for the markets I'm putting my magnifying glass on everything. The dollar has also shown some strength later in the day and silver is down quite big today. All are contributing to the bearish case, although it's not a very strong one yet.

Let's see if the Russell 2000 is again predicting future movement for the market with its 5 wave decline signaling it's topped and has resumed its downtrend. The bearish signal will remain intact as long as its highs of today remain intact at 593.57.

Brief Morning Update


Since we're at such a critical juncture in the market I wanted to post a quick note as to what I see this morning. The Nasdaq 100 came within 3 points of confirming the Dow's new daily high this morning, but was unable to, while the Composite is further back. The XLF and Russell are much weaker today than the Dow, S&P and Nasdaqs, and so is the DJ Transports index which is down almost 1% and could possibly have completed a C wave ending diagonal and is selling off back in "bear mode" again. I'll be watching the Transports closely today. This fracturing and failure to make new daily highs by other indices is important for the bears because if the main indices make new daily highs, it will be very bearish if the XLF and Russell, and others, do not make new highs with them. As of right now, they have a long way to go.

The US dollar continues to be the story I'm watching closely. Last night late in the Asian session they bought US dollars against the british pound solidly, and it pushed the dollar modestly higher against the euro and swiss franc. However those gain were mostly reversed in the European session, and now the dollar is up modestly as the US session is bidding it up at the moment.

The door is still open for a swoon of selling to come in and reverse yestrday's bullish move, especially if the dollar can find some footing and rally hard later in the day. So far, the market is having trouble getting bullish follow through from yesterday and so far this morning's internals are showing that as you can see on the above listed data circled in red. Also of note, silver, which is often looked at as a "risk indicator" is selling off quite nicely and has been much weaker the past few weeks relative to gold. Now the two metals could just be leveling off old divergences, but right now we need to pay attention to all signs available.

The bottom line is that nothing extraordinary has happened today on either the bullish or bearish side, however the market is leaning to the bearish side slightly at the current moment. The burden is on the bulls to get some follow through from yesterday's rally to convince those on the sidelines that this rally is for real.

More later as structure unfolds

Monday, November 9, 2009

Market Looked Strong Today, but Bearish Signals in Place for Now


Today's rally appears to again be on light volume as you can see from the volume bar registered today, and is in line with the lower volume bars on the entire rally from last week that have failed to break above the 10 day moving average. In regards to short term movements, the past several weeks have often had rallies on declining volume with selloffs on high volume, with the intensity of this trend increasing as of late. Typical behavior resulting from small amounts of folks manipulating the market when no one else is around to move it higher, but the masses come back later and push the market significantly lower, each time in the future will result in stronger selloffs as a result. I'm posting this at 1:20pm PST, so it's possible the volume bar will rise a bit, but not much, and if it does go up significantly I will come back and note it here.

Internals were very strong today and the Dow was on fire making a new daily high on the year, while the S&P recaptured its daily ascending trendline. So the market looks very bullish right now, right? Not quite. Let's bullet-point the bearish indicators we were left with today calling into question how long this rally can really sustain itself:

- only the Dow Industrials made a new daily high today while every other major index, and also the important XLF financial ETF, did not make a new high. With the Russell 2000 and XLF lagging significantly from making a new daily high.

- usually the high risk indices and securities like the Nasdaqs, Russell 2000 and XLF will lead rallies higher, but they are clearly not doing it this time. This action should concern the medium/long term bulls.

- the Dow Tranports index did not confirm the Industrials new high today which gives us a Dow Theory sell signal for the time being.

- the S&P did not break 1101 today which keeps the bearish case alive in the short term

- there was no real news today, and with light volume, it continues to tell us that this is a bear market rally, manipulated by a few people maneuvering the market around. When volume returns, it should be to the downside, and big.

- the US dollar was flat and actually rallied slightly when the Dow broke above 100 points in the positive today. The decline in the dollar is strong, but so far it looks like it's just an ABC decline. It too did not make a new daily extreme today which is another non-confirmation of the Dow's new high.

- the market will be hard pressed to rally high enough to have all the other indices follow to new highs and confirming their rise in the future as many of them are severely lagging this rise so far. Leaving other indices behind on a rally is very bearish if it holds.

- despite the large gains, strong internals, and the S&P recapturing the other side of the daily ascending trend line; it's possible that in a day or two all of that will be reversed which would negate the only bullish action that occurred today. So the reaction to this rally in the coming days is important.

So to sum up, today was a very bullish day for the short term, but we need to see the reaction tomorrow and Wednesday to really tell us if this move is the start of the next rally leg, or just a "fakeout" before a resumption of wave 3 or C.

As I stated earlier, today's strength caused me to protect myself a little if the market continues to rally in the coming weeks before making another top attempt. So I purchased short term December 2009 call options on the SPY and DIA. I purchased very small positions in order to help offset the time erosion that would occur on a continued rally to my long dated Dec 2010/Jan 2011 options.

My Trading Disclosure

I just wanted to inform you all that later this morning I purchased some short term call options with a Dec. 2009 expiration on the DIA and SPY to help offset the time erosion I'll incur on my long dated put options (Dec 2010/Jan 2011) before the crash occurs. The idea is to profit in the short term from this short term rally and profit from the long term collapse with long term put options.

Strong Rally Threatens 1101; But Market Fractured


Today's rally is very strong internally (see attached data with red circles) with a lot of buying conviction and a weaker dollar offering it a nice tailwind. So the 1101 level I sighted as solid resistance is now looking very vulnerable. But let me be clear when I say that when a stop is placed, it should sit until the market takes it out. I've seen crazy things happen as a trader, and it would not surprise me if the S&P hits 1099 then sells off 100 points immediately. I'm not predicting that will happen, but it's possible, and it's the reason why when a stop loss is placed, it's there for good unless it's going to be moved closer/tighter.

With that bullishness said, the stock market is very fractured. Check out the attached charts comparing the Dow Industrials, S&P 500, DJ Transports, and Russell 2000. The Dow Industrials made a strong new high today, which is why the Dow was not falling impulsively earlier, it was a clear correction that wanted to make a new high before it topped. However the other major indices did fall impulsively (5 waves), which may possibly mean they will NOT make new highs. Without confirmation and new highs from the other indices, it would be extremely bearish. Especially if the DJ Transports do not make a new daily high with the Industrials, it will issue a Dow Theory sell signal, which is a big deal. As you can see, with the exception of the S&P, the other indices along with the XLF an even the Nasdaq Composite, they still have a ways to go to get to a new daily high; can they make it???

An S&P break of 1101 DOES NOT eliminate the larger bearish scenario for a wave 3 or C. It merely will postpone it. And if these other indices lag and cannot make new highs, it will be a very telling bearish signal for the next attempt at calling a top. The market has not sold off enough to alleviate the exhaustion it's experiencing on many technical levels, and I feel the dollar weakness is really the fuel to this rally. So this may just be a "blow off" top. When the dollar turns, the stock market will do so, and hard.

So let's watch these other indices and see how well they rally as we watch the S&P 1101 level and we'll go from there. Until 1101 is broken, the strategy is the same as it always has been. If 1101 is broken, we will simply stand by and wait for our next bearish opportunity.

Sunday, November 8, 2009

Market at Crossroads


I spent some of the weekend pouring over the bullish and bearish evidence and the result is several bullish AND bearish arguements that essentially cancel each other out. Instead of listing all of them, which I feel will only net a neutral outlook anyway, I thought I'd just simply state that early this week will tell us the medium term direction in the market. The market has been consolidating late in the week which usually means a "break out" is coming. If the market tanks early this week, then the bearish outlook will be on very firm ground in the medium term and all is well for our bearish case. But if the market rallies steadily on strong internals, then the 1101 in the S&P will be extremely vulnerable. A sharp rally and reversal early Monday morning does not count, and that would actually be bearish.

Watching the US dollar this afternoon into the Asian session may be telling of what will happen tomorrow in the stock market. The stock market should move opposite the dollar so following it into the US stock market session may give us a clue which way this market is about to "break out" in the coming days/weeks.

No matter what the short term holds, a continued rally to new highs above 1101 DOES NOT eliminate the larger wave count and outlook posted at the right side of this blog. The message is claer, with 5 waves down from the 2007 highs, the larger trend is down and I strongly feel the March 2009 lows will be broken. A new high above 1101 in the S&P will only mean another delay in its charge toward that goal.

StatCounter