Friday, June 24, 2016

Elliott Wave S&P Analysis

Elliott Wave S&P Chart

Well it was a killer day for me in the markets as I did not lose a single trade, both in futures and options trading.  I love this volatility, and it is unusual to get this in the summer.  Albeit, it took a major event in England to do it, it was still a pleasant surprise and I'm going to have a nice weekend with the profits.

The S&Ps dropped about 30 points from my post this morning and did not reach my projection of 2000 by the end of the day, which means the bears will be back in charge early next week.  Remember, the S&Ps were down 110 points in the Globex session and once the US session started, a tone of buying entered the market pushing the index up from about 75 points down, to around 45 points down.  So 30 S&P points were bought up in the early US session, and when you add the other 35 points bought up in the late Globex session, there was a ton of buying power used up early this morning.  So, how much more bulls are left?  And how many bulls still have enough buying power, and feel comfortable using that buying power, going into next week.  I will argue - not many.  So, expect lower levels early next week and watch the S&Ps drop to 2000, then to possibly 1980, and perhaps even lower than that.

You can check out my 4hr chart I posted from this morning to see the bigger picture, and then check out my chart above with a 10min chart and wave count to break down the analysis with greater detail.  You can see from this 10min chart wave count that the S&Ps have a lot of bearish potential.  But don't overthink it and try to get this decline narrowed down to a mathematical certainty.  Just note that the bottom line is that the market is very bearish right now, surprises will be to the downside, and the bulls have a lot of work to prove they are back in charge.

Please support the blog and like this post :-)


PLEASE NOTE: THIS IS AN ELLIOTT WAVE BLOG EXPRESSING AN OPINION AND IN NO WAY GUARANTEES OR IMPLIES ANY PROFIT OR GAIN. TRADE AT YOUR OWN RISK.

Elliott Wave Option Signals - Closed JEC (+60% profit) and DNB (+57% profit)

Elliott Wave Option Signals JEC

Jacobs Engineering Group (JEC) tanked hard with the rest of the market today.  Although it outpaced the S&P's decline as the S&P dropped 3.6% and JEC dropped 6.46%.  I do feel that it will continue to make its way lower towards 38% Fibonacci at $48.38, but with a 6.46% drop that has significantly outpaced the stock market's decline, I wanted to take profits on this right now as a sharp rally to get back on pace with the overall market can easily happen Monday.  Plus, with options, I don't want too much meandering around before getting to my target as it can erode premium.  The original trade setup is here.  And here is the final trade result:

Closed JEC Aug 19  47.5/52.5 put spread at $2.53 for a 60% profit


Elliott Wave Option Signals DNB

Dun and Bradstreet (DNB) fell hard today as well, -4.9% at the close.  I may regret closing this one as I do strongly feel it was too early, but with such a huge down day in the market I want to take profits where I could and this was the best choice of the other options available.  With that said, I still pulled a 57% profit on this guy.  This stock has the potential to move significantly lower, with the first stopping point $118.75, but potentially to 50% Fibonacci retracement and a prior 4th wave at $107.43.  I'm happy with my gain though, so I will count my money and skip off into the sunset with it.  The original trade setup is here.  And here is the final trade result:

Closed DNB Aug 19  115/130 put vertical at $7.37 for a 57% profit


Please support the blog and like this post :-)

PLEASE NOTE: THIS IS AN ELLIOTT WAVE BLOG EXPRESSING AN OPINION AND IN NO WAY GUARANTEES OR IMPLIES ANY PROFIT OR GAIN. TRADE AT YOUR OWN RISK.

Elliott Wave S&P Futures

Elliott Wave S&P Futures

Brexit wins, the UK is going to progressively negotiate its way out of the EU, and the markets are in turmoil as no one knows what this will really mean for the global markets.  My guess is, not much.  However, markets hate uncertainty, so you're seeing this panic selling today.  Last night when the vote tallies showed that the "Leave" side was probably going to prevail, the S&Ps dropped 110 points.  This after it was up about 12 points that afternoon.  So that's a 122 point drop! 

The market will head lower.  Remember, this is a ((c)) wave within a Minor wave 2, both of which are strong and sharp moves.  The rally from this morning were bargain hunters getting "discounts" on stocks at the open.  Long term, they will be right, but short term, they will be hurt as this market should roll over and decline towards 2000 by the end of the day.  The market rallied for several days, with the anticipation that the UK would vote "Stay".  Not sure why that increases stock values if everything remains the same, but it did rise.  I suspect that was just speculators, day traders, etc. pushing the markets higher to play with the market while the big players stayed on the sidelines until after the vote.  Now that the vote is in, all that rallying needs to be unwound, and many people will be bailing on stocks until certainty and stability returns to the global markets.

There should be at least one more push down towards the 1980-2000 range before any meaningful bottom can be considered.

Please support the blog and like this post :-)


PLEASE NOTE: THIS IS AN ELLIOTT WAVE BLOG EXPRESSING AN OPINION AND IN NO WAY GUARANTEES OR IMPLIES ANY PROFIT OR GAIN. TRADE AT YOUR OWN RISK.

Elliott Wave Options Signals - Closed JCI for 48% Profit

Elliott Wave Signals

JCI decided to traverse higher for several days in what appears to be a "flat correction" with wave ((b)) [not shown] testing the Minor wave 1 high and reversing.  The decline this morning as part of Minor wave 2 satisfies my objective and therefore I closed the position at a nice 48% profit.  The original trade setup is located here.  Here is the trade conclusion:

Closed JCI July 15  41/45 put spread at $1.85 for 48% profit

Please support the blog and like this post :-)


PLEASE NOTE: THIS IS AN ELLIOTT WAVE BLOG EXPRESSING AN OPINION AND IN NO WAY GUARANTEES OR IMPLIES ANY PROFIT OR GAIN. TRADE AT YOUR OWN RISK.

Elliott Wave Options Signals - Closed NOC for 83% Profit

Closed NOC for 83% Profit

Northrop Grumman fell hard with the rest of the market this morning and hit my target level and I closed the trade at a hefty 83% profit.  Minor wave C just needed to clear wave A to satisfy EWP's "flat correction" rule and that's what it did.  I think this can easily fall further to the 38% Fibonacci but it will do so without me in the trade as my objective was met.  Click here for the original trade setup, and here's the conclusion:

Closed NOC July  210/220 put vertical at $6.75 for 83% profit


Please support the blog and like this post :-)


PLEASE NOTE: THIS IS AN ELLIOTT WAVE BLOG EXPRESSING AN OPINION AND IN NO WAY GUARANTEES OR IMPLIES ANY PROFIT OR GAIN. TRADE AT YOUR OWN RISK.

Wednesday, June 22, 2016

Elliott Wave Forex Signals - Closed 2nd Half of GBPNZD for 156 Pip Profit

Closed 2nd Half of GBPNZD

Sometimes I'm amazed at how well Elliott Wave and Fibonacci levels can project the market.  Look at the charts I've had on this pair the several days (below).  You can see the pair has traced out exactly as I projected.  Unfortunately, I did not profit from the entire move, I exited the remainder of my position at 2.0375.  So a 103 pip profit on half position and 156 pip profit on half position results in an average profit of 130 pips on a full position.  Here is a previous post illustrating my projections on the GBPNZD

The markets are positioned where they want to be before the British vote a little over 12 hours away.  So I don't expect much action unless something is leaked about the results, or projected results.  I am going into that vote as light as possible, i.e. no forex or futures positions.  I would be very careful for anyone holding forex positions into that vote as currencies have the potential to move extremely fast, and stops may not get triggered as intended.

As for the S&Ps, the bullish move I projected from the 130min VIX buy signal has been fulfilled as is no longer valid.  I have no signals either way on the market now, but the wave count I have is bearish.  I plan to wait for the dust to settle from the vote tomorrow before I make any more trades.  

Please support the blog and like this post :-)


PLEASE NOTE: THIS IS AN ELLIOTT WAVE BLOG EXPRESSING AN OPINION AND IN NO WAY GUARANTEES OR IMPLIES ANY PROFIT OR GAIN. TRADE AT YOUR OWN RISK.

Monday, June 20, 2016

Elliott Wave Stock and Option Signals - Went Short JEC and DNB

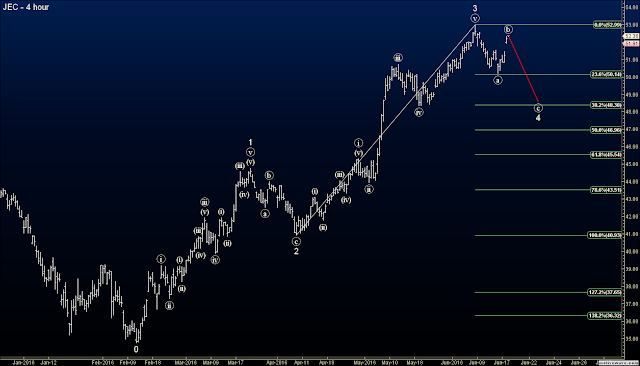
Jacobs Engineering Corp (JEC) chart


Jacobs Engineering Corp (JEC) has been on a monster rally the past few months.  The wave count and my custom indicators suggest a pullback here is warranted, and the put spread is profit target is desirable.  Wave ((c)) should take hold soon and drop the stock to the $48 area.  So I went short with the following trade:

Buy to open JEC Aug 19  47.5/52.5 put vertical at $1.58


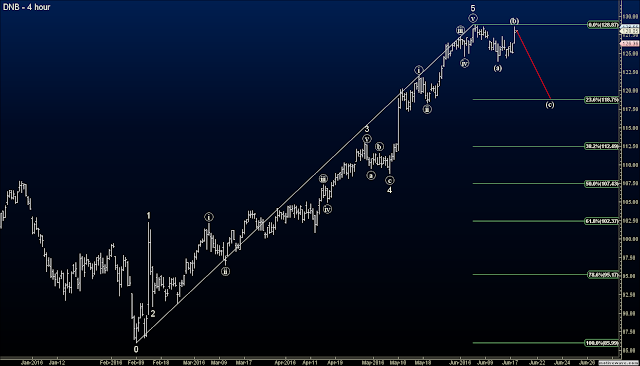
Dun and Bradstreet Corp. (DNB) chart


Dun and Bradstreet Corp. (DNB) has also been on a monster rally the past few months.  However, my custom indicators fired off a short confirmation signal, and the wave count suggests a Minor degree 5 wave move has completed.  Wave (c) is probably about to take hold within what will probably be a wave ((w)) in a combination correction.  The wave (c) drop should pull the stock to around $118.75.  Here is the trade:

Buy to open DNB Aug 19  115/130 put vertical at $4.68


Please support the blog and like this post :-)


PLEASE NOTE: THIS IS AN ELLIOTT WAVE BLOG EXPRESSING AN OPINION AND IN NO WAY GUARANTEES OR IMPLIES ANY PROFIT OR GAIN. TRADE AT YOUR OWN RISK.
Elliott Wave Futures - S&P Analysis

Elliott Wave Futures - S&P Analysis

Stocks continue to obey my commands in how it plays out as you can see my red lines have predicted price quite well. Stocks are rallying on expected news of that British vote. I expect a choppy float modestly higher before a top and reversal to complete Minor wave 2 down.

I also used this rally as an opportunity to get short two more stocks in JEC and DNB. I will post analysis and trade details later when time permits.

Please support the blog and like this post :-)


PLEASE NOTE: THIS IS AN ELLIOTT WAVE BLOG EXPRESSING AN OPINION AND IN NO WAY GUARANTEES OR IMPLIES ANY PROFIT OR GAIN. TRADE AT YOUR OWN RISK.
Sunday, June 19, 2016

S&P Futures Wave Analysis

S&P Futures

Here is an updated chart from my last post on the S&Ps.  It has following my projected path so far, so let's see how it continues to unfold.  The larger trend is down, so surprises will be to the downside.  I do favor a push higher to complete wave (ii) although it is not required.  Also, remember that I have a VIX buy signal registered from last week I illustrated in a previous post.  It was on the 130 minute chart (1/3 cash session), which also supports a rally to complete wave (ii) as well.

Please support the blog and like this post :-)


PLEASE NOTE: THIS IS AN ELLIOTT WAVE BLOG EXPRESSING AN OPINION AND IN NO WAY GUARANTEES OR IMPLIES ANY PROFIT OR GAIN. TRADE AT YOUR OWN RISK.

Elliott Wave Blog - Closed ALB and ACN at 100% Losses

Elliott Wave Blog - Closed ACN Original

Well this sucks, ACN and ALB both fooled me and surged higher, making my put spreads worthless and expiration.  Although this is rare, and part of the trading game, it is still unpleasant.

Above is my original setup and analysis.  I projected a Minor wave C of Intermediate (2) to unfold, which would be a sharp decline.  It also fit well into the wave 2 characteristics of a sharp and deep correction...


Elliott Wave Blog - Closed ALB Updated

Instead, the stock rose to a new high in what looks like a B wave within a "flat correction".  This is odd for a wave 2 since a flat correction is considered a sideways correction, like a triangle, so they are often in 4th waves, not 2nd waves.  Regardless, as always, the market was right and I was wrong.  I won't trade this setup again, but the sell signal is still in a confirmed status, and even more overbought than before.  I think wave C will bring the price down to just below wave A and to Fibonacci support around $110.60.


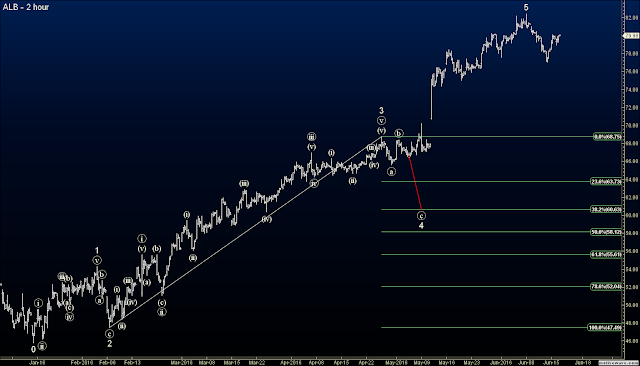
Elliott Wave Blog - Closed ALB - Original

ALB was in a similar situation only I had it in a 4th wave correction, not a 2nd wave.  I was anticipating a sharp ((c)) wave down to profit on.  I didn't get it.

Elliott Wave Blog - Closed ALB Updated

Instead, it appears the stock formed a triangle correction, which is typical for 4th waves.  However, the severe overbought indicators and confirmed sell signal I received is not typical to precede a 4th wave triangle, so that's where I got fooled.

This stock is also even more overbought than before so it's a good trade, but I won't be taking it.  One punishment is enough.  It appears wave 5 is complete, and a large correction down should occur, taking price to the apex of the triangle and Fibonacci support in the $64-$68 area.

Please support the blog and like this post :-)


PLEASE NOTE: THIS IS AN ELLIOTT WAVE BLOG EXPRESSING AN OPINION AND IN NO WAY GUARANTEES OR IMPLIES ANY PROFIT OR GAIN. TRADE AT YOUR OWN RISK.

StatCounter