Friday, November 6, 2009

S&P Bumping Against Strong Resistance


A quick note, the S&P cash is bumping against the daily ascending trendline I've mentioned here a few times. This is typical behavior after the break of such a significant trendline in that there's usually a retest of the underside before reversing again. When you add what I said about other resistance levels this morning, the S&P is in a perfect place to top soon.

It seems that traders are taking the day off, maybe a lot of folks are getting Monday off for the holiday and left town early. But volume is low and we've basically been flat all day. There might be a short covering rally at the end of the day if this continues because the bears usually don't want to go into a weekend holding their short positions.

So there's no strong evidence of a top, but the market is currently at levels that would market nice reversal points.

S&P Hits Resistance, Waiting for Top Now


With the Fed announcement and jobs number out of the way, we can focus on technicals again. The market started off weak, Dow down about 55 at the open, but rallied right after that well into positive territory where the markets are pretty much flat right now. Internals have a slight bearish bias to them but nothing spectacular. Financials (XLF) are really struggling today, down over 1%, and the Russell 2000 is modestly weaker than the Dow and S&P, but it was much stronger yesterday so it kind of balances out. Nothing is really standing out suggesting a top is in other than the fact that the S&P has bumped up against my resistance line (shown in attached chart) and has retreated a little after doing so. The dollar has been relatively flat the past few days so there are no signs there.

So again, we watch, and wait for the wave (2) top and reversal. A break of the S&P cash 1045 would strongly suggest a top is in place and the next round of heavy selling is underway. If anything stands out as the day goes on I'll mention it here.

Thursday, November 5, 2009

Steve Hochberg from Elliott Wave International on CNBC

I guess it's an Elliott Wave International (www.elliottwave.com) sweep this week with Robert Prechter on yesterday and now Steve Hochberg on CNBC this morning. Just thought you'd want to see the interview. Funny, whenever Hochberg is on CNBC they tend to try and marginalize him, but I don't recall those same folks warning the public about the 2007 top and crash like Hochberg and Prechter did. So you can thank the media for not warning the public, and then staunchly criticizing and trying to minimize someone who did warn the public.


Surprises will be to the Downside


With the larger trend firmly down at this point, it's key to remember that surprises will be to the downside. My prior post merely points to the direction that seems most probable with the evidence at hand. However the market rarely moves perfectly to plan, and gives us surprises constantly. When the larger trend is so strongly down at this point, those surprises will be on downside movement. So in case I'm wrong about my short term bullish outlook, we need to watch for the market to break down lower in the next wave of heavy selling.

Above are charts of the Russell 2000 and the S&P 500 cash at the 15min intervals. The way the structure is unfolding now, it would be real hard to keep a bullish case at the forefront if the wave b lows were broken. So I drew lines of support for the short term bullish case at the wave b lows which are at 563 in the Russell and 1045 in the S&P. Any solid break of these lines should inidicate the next wave of selling is underway. Most likely, the Russell be the first to break this line and lead the way as it has been doing the past couple weeks.

So to sum up, I'm long term firmly bearish below the S&P 1101, but am short term bullish until S&P 1045 AND Russell 563 are broken.

Wave (2) Still Underway


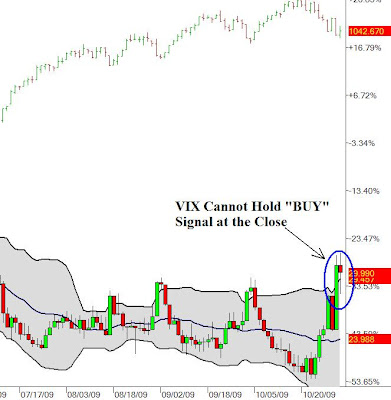
With the VIX/Bollinger Band buy setup still in play, and with wave 2 looking quite pathetic in time and price yesterday, wave (2) decided to fulfill its normal structure and rally higher today. NYSE internals are very strong on this rally with 4.7 stocks trading up for every 1 trading down, and 83% of total volume to the upside. Also the S&P has 461 advancers and only 34 decliners. So this is strength across the board in every sector today. This is often how bottoms and rallies to highs have started so we have to be very watchful of the action in the coming days. Tomorrow is the jobs report and the past several months have brought rallies all day no matter what the data showed. So I'm prepared for further solid strength tomorrow as well. We also must be aware that the last 3 times the VIX gave this buy setup, the market has bottomed and rallied to a new high. I don't feel that will happen this time, but we should be aware of that fact, and understand that we probably will have some nail-biting days ahead of us as we watch the 1101 level in the S&P.

That's all just speculation from all the data I have surrounding me. The key is the EWP picture and it shows that we are in a wave C within wave (2), which was expected, and targets for resistance may be at 1067 and 1072. Wave Cs within wave 2s are very powerful affairs that often look like a new trend is starting when in fact it's a countertrend that's ending.

I remain fully short as I have been, watching 1101 in the S&P and psychological prepared for some solid strength at least today and tomorrow.

Wednesday, November 4, 2009

Bearish Reversal Day Today; Signals Next Round of Selling Underway


I'm impressed at how well the Russell 2000 has been such a good market forecaster in this declining phase we're in currently. My post this morning illustrated the Russells' 5 wave decline right before the Fed announcement. The Russell never came close again to its highs, and the XLF, DJ Transports, Nasdaqs, S&P and eventually the Dow all followed lower into the close. Needless to say, I'll be watching the Russell closely until it proves it's no longer a good indicator of future market movement.

Today the market rallied as I said was possible yesterday, after those bullish signals were registered. However the market did not rally as long or high as I thought, so we still have to keep that in mind and prepare for more upside until this week's lows are broken at 1029 in the S&P. However, the big reversal after the Fed announcement was quite impressive at the end of the day, and it flipped the pretty positive internals on the NYSE from very positive to basically flat, and over 400 stocks in the S&P were trading up before the announcement which ended up also closing almost even for decliners and advancers.

As you can see from the above short term and daily S&P cash charts, it's possible to count the rally today complete for wave (2). But it's just so shallow and short on time that I'm still skeptical that it's over. So I'm on psychological guard right now. However, if we are in a big wave 3 or C crash right now, this short and small rallying should be the norm in most of the decline as these waves are very very powerful. A break of 1029 will eliminate any doubt that wave (2) is complete and signal that a small wave (3) down was underway which should quickly get the S&P to at least the mid-900s in a hurry.

Until wave (2) is solidly confirmed, my breaking point for the immediate bearish crash case is the 1101 level in the S&P cash.

EWP Godfather, Robert Prechter, Speaks.....

Robert Prechter has been the key player in scholarly work fine tuning and catapulting EWP into the 21st century. His work has changed my life, and the lives of my friends and family, by giving us the wisdom to navigate through these tough times. I can't thank him enough. He spoke to CNBC this afternoon:


POLL: What Economic Recovery? Obama, Unemployment and Foreclosures

Here's a good CBS article showing the truth about the smoke and mirrors that make up the so called "recovery" we are in. The underlying truth is that there is no recovery, and it only appears that way due to the dollar's weakness which has caused corporate earnings and stock prices to go up. But there has been very little fundamental improvement and jobs are continuing to be lost. Last night voters turned out and said the economy is their biggest concern and so they ousted their incumbants from office. Does that sound like a justified 60% rally in the stock market?? Recovery? Or smoke and mirrors?

Article link:

http://abcnews.go.com/PollingUnit/Politics/economic-recovery-abc-news-washington-post-poll/story?id=8891003


FULL ARTICLE:

POLL: What Economic Recovery? Obama, Unemployment and Foreclosures
ABC News-Washington Post Poll: 82 Percent Say Recession Is Not Over
ANALYSIS By GARY LANGER
Oct. 23, 2009—


From the public's perspective, the rumors of economic recovery are greatly exaggerated.

The latest ABC News/Washington Post poll put it this way: "Many economists say that using the standards they apply, the recession probably is over. Thinking about your own experience of economic conditions, would you say that from your point of view the recession is over, or not over?"

Result: Not over, 82 percent.

Click here for PDF with charts and questionnaire.

That marks more than the disconnect between definitions of recession; it also points to the land mines that pockmark the political landscape, threatening potential woe to President Obama in particular and incumbent office-holders in general. Claims of a recovery that few people feel are fraught with the taint of disconnect.

GDP aside, plenty informs the public's continued experience of recession: unemployment, especially including people who've given up looking; declining work hours and personal income; foreclosures and more. It's also reflected in the ongoing ABC News consumer index, in which 89 percent rate the economy negatively, 77 percent call it a bad time to spend money and 59 percent say their own finances are hurting  all near their lows in 23 years of weekly polls.

Indeed, contrary to rumors of recovery, 74 percent in this poll are worried about the direction of the nation's economy over the next few years  down 14 points from its peak a year ago, but still three-quarters of the public. And six in 10 remain worried about their own family's financial prospects. These worries are very strong factors in belief the recession's not over.

Many also are baring their teeth at executives of companies associated with the carnage. Seventy-one percent support cutting executive compensation at companies that received emergency government loans in the past year. Fifty-eight percent support it strongly.

POLITICS  Politically, the economy very probably is the single biggest threat to Barack Obama. Well under half of Americans, 41 percent, think his economic program is making it better  which is part of the reason why, by 57-38 percent, the public opposes spending more on recovery efforts if doing so would increase the federal budget deficit.


Obama, the Economy and Deficits
That doesn't give Obama a lot of wiggle room. As things stand, his approval rating for handling the economy has slipped to 50 percent, barely below a majority for the first time and down 10 points from its high in the spring. On handling the deficit, he's lower still (albeit up a bit from last month's rating) at 45 percent approval.

It is extremely difficult for a president to thrive in a bad economy. In conditions much like these, Ronald Reagan went from 73 percent approval to 48 percent in his first year in office. The first President Bush went from 69 percent to 33 percent in 11 months during the long slog out of the 1990-91 recession. And the failing economy helped push George W. Bush to 23 percent approval almost exactly a year ago, 1 point from the lowest in 70 years of presidential approval polls.

RISKS/GROUPS  The political risks also are illustrated by the first President Bush, who in 1992 said the economy wasn't so bad after all. He was technically right  the recession, as classically defined, long had been over  but it wasn't experienced that way by most Americans. Bush paid for the disconnect by losing his re-election bid that fall.

The discontinuity can last a long while, depending on the strength and speed of recovery. While the 1990-91 recession technically ended in March 1991, unemployment didn't peak until June 1992, and consumer sentiment didn't regain its pre-recession levels until June 1994. After Bush suffered, so did the Democrats, with the loss of Congress in the 1994 midterms.

Those experiences raise the stakes in comments such as Fed Chairman Ben Bernanke's last month, when he said the recession is "very likely over," and in congressional testimony yesterday by Christina Romer, chair of Obama's Council of Economic Advisers: "A recession that showed no signs of ending last January appears to be firmly entering the recovery phase."

Again from the public's perspective, there's not a single group or region of the country in which more than 28 percent think the recession is over. Among people with household incomes under $100,000 a year, 84 percent say the recession's still going  but in the wealthiest households, 75 percent say the same. Among people who don't have a college degree, 85 percent say it's not over  but so do 76 percent of college graduates.


The Recession, Republicans and Democrats
Eighty-seven percent of women and 77 percent of men say the recession's still on. So do 88 percent of conservatives, 81 percent of liberals and 79 percent of moderates; and 85 percent of independents, 84 percent of Republicans and 79 percent of Democrats.

Worry about the future, especially in terms of Americans' own household finances, also crosses political lines. On the recession, then, bipartisanship prevails  economists aside.

METHODOLOGY  This ABC News/Washington Post poll was conducted by telephone Oct. 15-18, 2009, among a random national sample of 1,004 adults, including landline and cell-phone-only respondents. Results for the full sample have a 3.5-point error margin. Click here for a detailed description of sampling error. Sampling, data collection and tabulation by TNS of Horsham, Pa.


Copyright © 2009 ABC News Internet Ventures

Russell 2000 Made 5 Waves Down Today


Just a quick note on the Russell 2000 which is lagging the major inidices today. It just made a small 5 wave decline on the 5 minute chart (see attached chart). It may be a fakeout, but it's worth watching to see if the Russell again is telling us it's leading the way and that tops are forming.

I'm Letting the Rally Play out, Simply Watching....Waiting


The bullish signals I mentioned yesterday proved reliable as the wave count and some technicals needed to be alleviated and corrected. And what better time to do it than right before a Fed announcement? And we all know how extremely relavent and helpful our Government has been the past couple years..........well, we all know how helpful they've been to millionaires.

So today's internals are bullish as the bears usually slumber up to Fed announcements, but that can quickly change right after the announcement. The dollar has continued to pull back as normally the Fed could care less about slaughtering the dollar so I'm sure people are preparing for that and are selling ahead of the news, and buying gold to move out of their US dollars and into a hard assets. Which is what Warren Buffet essentially did yesterday by the way. He wanted out of cash and treasuries so he bought a railroad on a commodity play essentially. So the DJ Transports rallied 5% yesterday because of that, but did not come close to breaking above their daily trendline and today they are practically flat. Today we had worse than expected jobs and ISM data, so kinks in the armor of this "glorious recovery" are starting to show.

But enough rambling, there is no change to the top and collapse call I've been listing here on this blog. It's still underway, we're just in a corrective rally phase. Looking at the possible S&P cash wave count, we should be in a sharp wave C within a wave (2) right now (see chart above). Corrections usually go to previous 4th waves before reversing so lets watch the most recent 4th wave at 1067 for resistance. As a wave 2, it can technically go to 1100 and still be valid according to EWP, but since the trend is down in my view I'm going to constantly looking for topping and reversal points as it rises. Right now, I'm eyeing the 1067 level.

I know with the VIX buy signal executing yesterday there's a good chance we'll rally for days, so I'm prepared for that in case it does happen. The key again is the 1101 S&P level. As long as that stays intact, nothing changes the bigger picture.

Now we just sit back and wait a few hours for the government to try and manipulate our free markets and continue rallying the stock market on dollar inflation and smoke and mirrors.

Enjoy!

Tuesday, November 3, 2009

Several SHORT TERM Bullish Indicators Occured Today for the Stock Market


Today's action setup a short term bullish correction for the short term. I want to be clear that the larger trend is down and I strongly feel a large wave 3 or C is underway, which essentially is a large "crash" that will occur over several months with an ultimate target of at least the 500s for the S&P. For now, the 1101 S&P cash level should remain intact for a long long time. Today I'm merely presenting the facts as I see them which suggest a short term bullish move for the market for the coming days. Here are the bullish bullet points:

1) the VIX made a daily close beneath the upper bollinger band which concludes the buy signal (see chart attached). The last 3 times this occured, the market bottomed and rally to new daily highs. However I don't feel it will make it that far this time.

2) the Russell 2000 and Nasdaqs were stronger today and made new highs all day where the S&P and Dow struggled a bit to do so (the Dow was dragged down by Intel).

3) also, the daily Russell 2000 chart sports 5 waves down and then a bullish reversal candlestick formation (see attached chart). This suggests a corrective rally coming.

4) S&P and NYSE internals were pretty bearish this morning but flipped to be solidly bullish by the close. Nothing impressive, but it defintely showed the volume was coming in to the upside when the market rallied later in the day.

5) the dollar rallied nicely all last night into this morning but then reversed and is now forming a daily bearish reversal candlestick (see attached chart). The projection is that it's in a wave (iii) of 3 which is very bullish. So if the dollar doesn't accelerate its rally soon, something else is unfolding. The Fed announcement tomorrrow MAY do that. But right now, the dollar looks at least short term bearish which coincides with the bullish outlook for stocks in the short term.

6) tomorrow is the Fed announcement, and October's unemployment data comes out Friday. Both the Fed and unemployment announcements over the past several months have brought rallies to the stock market, no matter what the news was. This may not be the case anymore because the larger trend has changed to down, but until the market proves it's not true anymore we will assume that it is true.

7) lastly, many indices made inverse head and shoulders patterns (see S&P cash chart). As many of you know, an inverse head and shoulders pattern after a decline is a bottoming structure.

So lots of bullish action occured today which makes me conclude that the market has some bullish potential in the coming days. But I made no trades today and remain fully short, because I know that if the trend is down then surprises will be to the downside.

Monday, November 2, 2009

More Bearish Data


I also wanted to show you the very important daily ascending trendline I've been talking about. After some choppy action around it last week, the S&P held beneath the trendline convincingly today. The slope is so steep on the trendline that the longer it holds, the harder it will be for the bulls to regain. Also, if any rally attempt ensues this week, look for the trendline to cap any rallies on a closing basis. Tomorrow the trendline is at the 1061 S&P area.

Also, meandering through various markets and securities I wanted to note that market barometers Dow Utilities and Transports indices closed negative today (along with the recent market leader Russell 2000) with all of them also breaking below their October 2nd lows, along with the Nasdaqs, following the Russell 2000 which did so last week.

So as I implied earlier, the surface numbers on the markets look like a strong rally and bullish action today, but other than the positive close, I see all the underlying factors very bearish. The 5 wave dollar rally, flat NYSE internals, the VIX failing to call that "BULL SIGNAL", and weak key indices today warn of significant bearish underpinnings in the market right now.

Overall Bearish Day Today for Equities; Volatility Should Remain all Week


Today was a very volatile day, which usually occurs at tops as the bulls and bears fight it out. Today we had good economic data come out and so the Dow soared 145 points as I suggested was possible in my Friday post. But then the market sold off and actually put all the indices into negative territory today and to new lows from last week in the process. This is a sign of trend change; the fact that good news and rallies are being sold indicates the trend has changed to DOWN. NYSE internals were somewhat solid on the rally this morning but by the end of the day they were only slightly positive despite the big surge into the close. Also, the Russell 2000 did not quite make it into positive territory and the Nasdaqs lagged as well but ended slightly positive. All-in-all, a bearish day in my view. If I were a bull, I'd be very concerned with today's action. On the surface there were great earnings and forecasts the past few weeks, a good GDP number, and today held great economic data as well, yet the market could barely hold onto early gains and actually broke last week's low. That's bearish.

The VIX did not close beneath the upper bollinger band today as you can see on the attached chart, so there's no bullish signal from that area yet.

Also, the all important dollar did a big reversal and rally today after a pretty solid selloff from last night. The decline was left as a clear 3 wave drop, that we can see after the rally today, and that rally was done in a clear impulsive manner (5 waves, which means the trend is up now) as I posted earlier today. Above is an updated 1hr dollar chart and wave count and shows significantly bullish potential in the near future with a wave (iii) of 3 getting started. This should be a very powerful rally and should put significant pressure on stocks in the process.

Any rallying from here that stays beneath 1101 in the S&P cash is a great opportunity for the bears to get short in my view. I would be selling rallies, and definitely not looking for any long positions to buy at all at any timeframe at this point. Also keep in mind that the Fed announcement is this week along with unemployment numbers and these two events tend to bring about a lot of volatility.

Dollar and Stock Market Reversals Underway


The dollar bottomed and reversed later in the trading day which coincided nicely with my 2nd count posted earlier that had the decline from last night as a wave (ii). The dollar just rallied in 5 waves (see above 20min USD/CHF chart and count) which suggests the trend has returned to UP. If so, it should be in a wave 3 at multiple degree which means lots of strength and rallying like a rocket. This would also imply that the stock market is at the verge of the next round of selling.

NYSE internals have flipped to solidly negative while the Russell and Nasdaqs are leading the decline. This following great economic news and a 140 point Dow rally completely reversed is all extremely bearish for the stock market along with the bullish implications for the dollar.

Just a Quick Note on this Morning


I just wanted to write a quick note on this morning's action and will post a more in depth conclusive analysis of the day later:

Here are the bullet points of this morning:

- The market rallied sharply this morning as I thought possible, however there is somewhat light volume so far and NYSE internals are strong but nothing jaw dropping.

- The Russell 2000 made a new low this morning which confirms the lows in the other major indices.

- The higher risk Russell and Nasdaqs are not rallying as strong as the S&P and Dow, showing that risk appettites are still tame.

- As for the dollar, it pulled back quite a bit in either a wave 2 or wave C of a flat correction (see above two counts, both very bullish in once a bottom forms). Either way, it should wrap up in a day or so and rally in a ferocious wave 3. And with the Fed meeting this week, it sets up nicely for a big dollar rally.

- The S&P is trading close to the daily ascending trendline it closed beneath Friday so this is an interesting level. The trendline is at about the 1058 level so that may be the ceiling we're looking for-for the next wave down. We'll see.

These are just some thoughts to consider watching for the day, but keep in mind there is nothing conclusive to trade on other than the fact that a major decline is probably unfolding right now and 1101 in the S&P cash should not be exceeded for a very long time. The larger trend is firmly and strongly down, and there are a few bearish wave counts possibilities and some lead to heavy selling any minute so I am in not position to get in and out........I think the key here is to be patient and watch the S&P cash 1101 level. PATIENCE

StatCounter