Thursday, July 8, 2010

Wave (ii) Probably Has More to Go; Euro Gearing up for a Decline


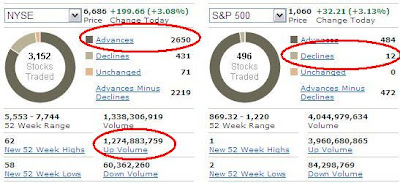
The market shot higher this morning at the open only to fall and flatten out during midday trading. Again, this might be chalked up to "Amateur Hour" back in effect where mostly amateurs come in during the first and last 30 minutes or so while the professionals trade during the meat of the day. This behavior didn't do us much good on Tuesday though since it led to a huge monster rally on Wednesday. Outside of the first and last 30 minutes of trading today, the market was quite flat. The late day surge turned the internals of the market quite bullish into the close, suggesting that we still have higher levels ahead of us tomorrow, and probably into next week. Also, there's no real big news data Friday, like most of this week, so the bulls will again be able to blind themselves to the economic decay occurring and just feed off each others' unrelenting optimism to float this market higher again.

One thing to note is that the internals were weaker than yesterday's, although still quite strong today, and volume was also quite light as NYSE volume didn't even reach the 13 day moving average. So the majority of volume spikes above the 13 day moving average still occurred on down days, showing us that the conviction of the market is still on the sell side, for now.

Enthusiasm and optimism have already come back strongly as there are headlines and analysts aready discussing the bottom in the market and talking about the decline being overdone and that earnings and the economy are not that bad. Far different from the "depression" headlines we had over the weekend. It's also the type of sentiment we want to hear as wave (ii) reaches its final stages. But the move higher this week on not so hot volume lends itself to the fact that the overall market is not buying into this rally.


Above is a speculative wave count of the wave (ii) correction. I have it as a comination, or double zig-zag, that should now be in wave 'c' of 'Y'. Wave 'Y' can complete any time now, but will probably get into the meat of the reversal zone before doing so, and if the rally carries into next week then it should get to the upper portion of the zone around 1084. There's also a gap to fill just a few points higher from current levels, so it still would seem that we have higher levels to go.

Another thing to note is the action in the euro that I mentioned this morning. Although the euro and the stock market have not been correlated that well lately, it's still worth noting if you're a currency trader, or for whatever correlation to the stock market that still might be left. The euro is completing what looks like an "ending diagonal" which is a finishing move that is quickly and sharply completely reversed. Although the reversal may only be a short term move, it still may be finishing up a much larger correction which could line up well to wave (ii) in the stock market finishing up if the correlation returns.

So the bottom line remains that I'm firmly bearish below 1131.23, but in the very short term it seems wave (ii) still has higher levels to obtain before the next round of heavy selling to lows gets underway. And there seems to be a good opportunity to start building short positions in the euro (or long the US dollar).


PLEASE NOTE: THIS IS JUST AN ANALYSIS BLOG AND IN NO WAY GUARANTEES OR IMPLIES ANY PROFIT OR GAIN. THE DATA HERE IS MERELY AN EXPRESSED OPINION. TRADE AT YOUR OWN RISK.

Euro Rally Fading Fast, Downward Reversal Imminent


Just a quick note on a good opportunity. I've been easing into a EUR/USD (euro) short position over the past week or so due to the clear 3 wave corrective structure it's formed in what should be a large wave 4. Now you can see an "ending diagonal" like pattern forming now. This is a sign of weakening trend, and that a sharp reversal is coming soon. The only problem is controlling risk since stop losses would be too tight at recent swing highs since this pair can easily just grind slightly higher for a while. The bottom line though is that this pair is about to reverse downward sharply and I want in on it as long as I can manage my risk on the trade appropriately. Also of note, if the EUR/USD is forming a major top and reversal in wave 5 to new lows on the year, it will be tough for the stock market to make any sustained rally. So the key 1131 level in the S&P I mentioned yesterday would seem safe for now if the euro is topping.


PLEASE NOTE: THIS IS JUST AN ANALYSIS BLOG AND IN NO WAY GUARANTEES OR IMPLIES ANY PROFIT OR GAIN. THE DATA HERE IS MERELY AN EXPRESSED OPINION. TRADE AT YOUR OWN RISK.

Wednesday, July 7, 2010

Market is Well Into Wave (ii)


So the market's declining momentum and bullish divergence last week (click here for post) told us the market was gearing up for a snap back rally from it's oversold condition. Yesterday's 5 wave decline fooled me, but I was able to exit around 1043 once the start of that 5 wave decline was breeched today. Today was quite a ferocious rally that was an across the board all bull move. You can see that the internals were very strong with almost only buyers in the market today. There was probably a lot of short covering today as the bears realized the easy pickens on the short side have already been made. With a wave (ii) now underway, I expect to get a minor feel of overall optimism and glee come back into the financial media with talk about great earnings and all the bad stuff already being priced in. Over the weekend there was a feeling of doom and gloom with headlines talking about the second Great Depression. This obviously was around the wave (i) bottom. So when looking for the wave (ii) top, we should get a bit of the opposite in the headlines which should talk up the recovery and "great stock values" again. This should alleviate the oversold condition the market was in just in time for a monstrous wave (iii) of 3 of [3] or C. Although this reversal can happen at any time, and it will be so fast that it will be tough to enter without a good strategy in place, I don't beleive this rally is over quite yet.


So let's start to look for area for a reversal. That way when the market approaches this level, we can anaylze the internals, momentum indicators, and wave structure to see if the market may be rolling over. You can see in the above S&P chart that a good reversal zone is between 1070 and 1084 since that is between the 50% and 62% fibonacci retracement levels of wave (i) down, and there is an open gap there too. So for now, I will expect the market to continue higher into this area where I'd expect to see some resistance and weakening of the uptrend. Any rallies would bring about good opportunities for the bears to get short this market with stops just above the start of wave (i) at 1131.23. And although today's internal strength suggests rallying the rest of the week at a minimum, the fact that we're in a wave 3 of [3] or C means that rallies can be very sharp and short lived. So I'm not falling asleep at the wheel on this one at all.

As long as the market stays below 1131.23, this market is very bearish in my view. However, a break above 1131.23 would be very bad for the bears, and would strongly suggest that we are back in bull mode and that the market will surge to new highs on the year. But I don't want to get ahead of myself since we're far far away from that level. The focus is on resistance in the 1070-1084 area for now, and I'm of the opinion that rallies should be shorted in the short term.


PLEASE NOTE: THIS IS JUST AN ANALYSIS BLOG AND IN NO WAY GUARANTEES OR IMPLIES ANY PROFIT OR GAIN. THE DATA HERE IS MERELY AN EXPRESSED OPINION. TRADE AT YOUR OWN RISK.

Tuesday, July 6, 2010

Larger Trend Remains Down

S&P 500 CASH INDEX COUNT


Friday I expressed caution for the aggressive bears, citing several pieces of evidence showing that the market was oversold, and that downside momentum was waning. This morning we got a big pop leading to a strong triple digit Dow rise with strong internals. However the rally didn't last long as less than an hour into the session the bears came out and pushed the market lower for most of the rest of the day, even at a couple points turning the market negative. So the market did indeed rally as the evidence Friday suggested, but it did so very quickly. This short rally and reversal action time and time again illustrates the struggles the bulls have been having in mounting and sustaining rallies. It also probably speaks to how strong this downtrend probably is.

Building on today's thesis of the larger trend being down, we can see in the above count that today's rally was quite possibly a 4th wave, and that perhaps the 5th wave is now underway since we can see a nice 5 wave decline from today's 1043 high. According to this count, the market will make a new low beneath 1011 before making a new high above 1043.


UNDERSIDE TEST OF KEY 1040 LEVEL, WHICH IS NOW RESISTANCE


Speaking of 1043.....that high today also represents an underside test of the key 1040 level that was important for the bears to take out in order to further confirm that a larger downtrend was underway. Once major key support levels are broken, they will then quickly be re-tested on the underside of that level, which has now become resistance. Today we got that test on the underside of the key 1040 level, and the market reversed sharply in 5 waves after doing so. This is a very bearish sign.


MARKET INTERNALS


Depsite most of the major indices closing positive today, and the Dow mounting a big triple digit rally this morning on strong internals, by the end of the day the internals of the market were mixed-to-flat. The NYSE had more declining stocks than advancing stocks, but had more up volume than down volume. This "mixed" picture is especially odd since the NYSE managed almost a 1% gain today overall. So even the internals of the rallies the bulls do manage to sustain into a close are still done on very anemic internal strength. The bulls' legs are clearly shakey.


INDEX TRACKER


Above is a list of how some indices closed on the day today. You can see that although the majority of indices closed positive today, but the high risk small cap indices were down big today, and the Nasdaq Composite barely eeked out a gain in the final minutes of trading. When taking in all the evidence previously mentioned here, the fact that the high risk indices lagged this rally badly today is more evidence that the bears are still firmly in control and that the larger trend remains down.


AMATEUR NIGHT


I've often heard that the first and last 30 - 60 minutes of trading is done by mostly amateur traders, and the meat of the trading day is done by the professionals. If true, the above 3min chart of today's action tells us a lot. I drew red lines at the halfway point between 30 - 60 minutes at both 45 minutes into trading this morning, and 45 minutes at the end of trading this afternoon. Notice that during those "amateur times" the market rallied hard while during the meat of the day when supposedly the professionals dominate the market, the trend was clearly down. Now most of us know that money is made by following the professionals, not the amateurs, and this chart is telling us that the professionals are selling this market. Also notice that the segment belonging to the professionals traced out a clear 5 wave drop. So the professionals all by themselves are telling us that the market's trend is down. I'm following the pros. 1043 remains the key level for the bears to defend for the immediate bearish case.


EUR/USD


Lastly I wanted to post a EUR/USD chart and count. It appears that the euro is wrapping up a large rally that I believe might be a large 4th wave. This is evident by the apparent 3 wave a-b-c rally that is finishing off wave 'v' of 'c' right now. If correct, the profit potential is enormous since this currency pair should drop over 700 pips before even trying to form a bottom.


PLEASE NOTE: THIS IS JUST AN ANALYSIS BLOG AND IN NO WAY GUARANTEES OR IMPLIES ANY PROFIT OR GAIN. THE DATA HERE IS MERELY AN EXPRESSED OPINION. TRADE AT YOUR OWN RISK.

Downtrend May Be Resuming


My latest posts warning of a snap back rally came to light this morning as the market surged higher to a strong triple-digit Dow gain. But the rally was short lived as the market is well of its highs and has now just declined in five waves just a few minutes ago as you can see from the 5 minute chart above. With a small 3 wave rally completing prior to that 5 wave decline we see now, we should be aware of a resumption of the downtrend.


The 15 minute chart above shows a possible wave count that puts the rally today as a wave 'c' of a three wave rally composing wave 'iv'. The five wave decline seen on the 5 minute chart at the top may signal that wave 'v' down is now underway. Wave 'v' will most likely get below 1011 at a minimum, before it even thinks about bottoming. 1043 remains key for this short term bearish outlook.


PLEASE NOTE: THIS IS JUST AN ANALYSIS BLOG AND IN NO WAY GUARANTEES OR IMPLIES ANY PROFIT OR GAIN. THE DATA HERE IS MERELY AN EXPRESSED OPINION. TRADE AT YOUR OWN RISK.

Monday, July 5, 2010

My Approach

The evidence suggests that a short term bounce may develop early this week. But since we're probably in a wave 3 of [3], that bounce may not occur until hundreds of more Dow points are removed. And although I play the "in-and-out" day and swing trader game in the short term, I do keep focus on the bigger picture for my longer term core positions that I rarely touch. The bigger picture suggests we are in a major downphase of the market that will work prices much much lower in the coming months, and perhaps years. So I feel sticking with the short side, as long as key levels aren't taken out, throughout this phase is a wise choice. If I feel a bounce is coming, I might take some profits on short term positions and look to re-enter on that bounce, but I would not even think about trying to get long, nor will I touch my longer term core short positions. It's also important that if I do play for a bounce, that I set a "sell stop" order beneath the current market price so that I can re-enter the market if I'm wrong about that bounce and the market were to just keep moving lower. Again, I'm only doing this with my short term trading capital as it will allow me to take aggressive positions for big potential gains, and I know that no matter what happens with those short term trades I still have my longer term short positions in that I don't touch. So I just wanted to explain my trading approach to the market as this decline progresses and be clear that I remain longer term short despite moving in and out of the market with other short term trades.

Below are a couple articles that I thought Prechter followers might be interested in:

With the US trapped in depression, this really is starting to feel like 1932

Dow Repeats Great Depression Pattern: Charts


PLEASE NOTE: THIS IS JUST AN ANALYSIS BLOG AND IN NO WAY GUARANTEES OR IMPLIES ANY PROFIT OR GAIN. THE DATA HERE IS MERELY AN EXPRESSED OPINION. TRADE AT YOUR OWN RISK.

StatCounter