Thursday, April 21, 2016

Elliott Wave Forex Signals - Long GBPAUD

Long GBPAUD

This sucker burned me for over 200 pips last time I tried to get long, but with an ABC "Flat Correction" counted, it makes sense how I got faked out last time.  This pair fired off a buy signal confirmation with today's close on the daily charts.  Since it's on the daily charts, it is a huge trade.  There is also long standing bullish divergence of price vs. momentum, and if it's a wave ((c)) up getting started as I have it labeled, it will be a sharp move up for hundreds of pips.  And lastly, a similar pair, the GBPCAD also fired off a bullish confirmation signals, something that didn't occur last trade, so that is also encouraging as well.  I want to enter only 1/4 position now and will consider adding more on weakness:

Bought 1/4 position at market at 1.8511
Stop Loss at 1.8270
Profit target at 1.9000

Please support the blog and like this post :-)


PLEASE NOTE: THIS IS AN ELLIOTT WAVE BLOG EXPRESSING AN OPINION AND IN NO WAY GUARANTEES OR IMPLIES ANY PROFIT OR GAIN. TRADE AT YOUR OWN RISK.

Elliot Wave Options Signals - ARW, DPZ, PLCE and MSI

It was a very busy day today as I close most of my options today at nice profits and moved into new positions.  Here is a summary of options trades closed this week:

HMY  +17%
BKH   +40%
EXC   +42%
EIX    +30%
T        +25%
SYY   +39%

I already detailed the trade setups and closures of the closed trades, so I'm going to briefly show my charts and trades for my new positions today:

Short ARW

Arrow Electronics (ARW) fired off a bearish signal several days ago but didn't confirm it until today's decline which tells me wave ((c)) of 4 is getting underway.  If so, I want in on it.  Now, earnings are next week which could bode well for my trade, but I am unsure how it will play out so I want to be cautious here.  I'm going in only at half a position and am moving out the options to June.  This way if the earnings response results in a sharp rally, I can add another half position short and be able to wait it out until June:

Bought HALF position ARW put vertical at 57.5/65 for $2.35


Short DPZ

Domino's Pizza (DPZ) fired off a short signal over a week ago but it was not confirmed until today as a mature wave 5 of (5) appears to have completed.  This is in a similar position as ARW in that earnings is going to be announced in 7 days so I want to allow for an earnings spike higher and be able to add to the position and have enough time.  So I'm only going in half a position on the June options:

Bought HALF position DPZ put vertical at 125/140 for $5.20


Short PLCE

I've been watching Children's Place Inc. (PLCE) for several weeks and there have been sporadic bearish signals the past two weeks but no confirmations.  My patience paid off as you can see that the past couple weeks this stock as rallied sharply in wave B.  But I think this might be a good opportunity to start getting short this stock as price close right on the bearish signal confirmation line, wave A looks like like a 5 wave impulsive move so it is unlikely to be in a "Flat Correction" which would take wave B above $84.91 (in Flat Corrections, wave A is three waves).  Also, earnings are out in 3 weeks and I want to start getting short cautiously.  So I'm doing half a position in June options:

Bought HALF position PLCE put vertical at 72.5/82.5 for $3.32 


Short MSI

Motorola Inc. (MSI) fired off a bearish signal the end of March, it was not confirmed, and then continued to rally.  The past week there have been consecutive bearish signals in place that has finally led to a confirmation at today's close.  The wave count suggests a sharp wave 2 down may be getting underway now.  Earnings are in 2 weeks but the price action, signal and wave count line up well here to get fully short:

Bought MSI put vertical at 67.5/75 for $2.24

Please support the blog and like this post :-)


PLEASE NOTE: THIS IS AN ELLIOTT WAVE BLOG EXPRESSING AN OPINION AND IN NO WAY GUARANTEES OR IMPLIES ANY PROFIT OR GAIN. TRADE AT YOUR OWN RISK.

Elliott Wave Option Signals - Closed SYY at 39% Profit

Closed SYY at 39% Profit

Sysco (SYY) spiked down today and had some more follow-through into the close so I set a limit order off the current mid price at $1.25 to see if it would fill and it did so just a few minutes before the market closed.  It is close enough to my target and a confluence of indicators to take profits, so I did.  Notice how price is approaching both channel support, and the 38% Fibonacci retracement at $44.65.  Plus, wave 4 is getting very close to the price territory of wave 1, which cannot have any overlap.  So the decline here may be limited.  Here is the trade summary:

Bought SYY put vertical May 20 44/47 at $0.90 sold at $1.25 for 39% profit.

See post with original trade setup: click here

Please support the blog and like this post :-)


PLEASE NOTE: THIS IS AN ELLIOTT WAVE BLOG EXPRESSING AN OPINION AND IN NO WAY GUARANTEES OR IMPLIES ANY PROFIT OR GAIN. TRADE AT YOUR OWN RISK.

Elliott Wave Options Signals - Closed T (AT&T) at 25% Profit

Closed T (AT&T) at 24% Profit

AT&T (T) has had a nice sharp decline close ti my target price so I closed the position at a respectable 24% profit.  It will likely continue lower to the 38% Fibonacci retracement level at $37.31 over the next few days but I will take my profits and run on a sharp decline like I got over the past three days.  Here is the trade summary:

Bought T put vertical May 20 27/39 at $0.72 and sold at $0.90 for 25% profit.

See original post with trade setup: click here

Please support the blog and like this post :-)


PLEASE NOTE: THIS IS AN ELLIOTT WAVE BLOG EXPRESSING AN OPINION AND IN NO WAY GUARANTEES OR IMPLIES ANY PROFIT OR GAIN. TRADE AT YOUR OWN RISK.

Elliott Wave Option Signals - Closed EIX at 30% Profit

Closed EIX at 30% Profit

Edison Intl. (EIX) declined rather quickly after I placed the trade in an ABC zig-zag fashion.  I don't see this move complete yet as it appears that it will at least decline to the 38% Fibonacci retracement level at $66.72 to complete wave (c).  But price has already hit my target so I am out of the trade at a nice profit.  Here is the trade summary:

Bought EIX put spread May 20 65/72 for $2.74 and sold it for $3.55 for a 30% profit.

HERE IS THE ORIGINAL TRADE SETUP:


Elliott Wave Option Signals - Edison Intl.

Edison International (EIX) is showing signs of a weak wave ((v)) of 5 of (3) and is now undergoing a pullback to the $66.72-$68.89 area.  This is the 23% and 38% Fibonacci retracement levels and is also the area of the previous fourth wave, wave ((iv)), so it's a good area to look to exit this short trade.  Here is my trade:

Buy to Open EIX May 20  65/72 Put Vertical @$2.74

Please support the blog and like this post :-)


PLEASE NOTE: THIS IS AN ELLIOTT WAVE BLOG EXPRESSING AN OPINION AND IN NO WAY GUARANTEES OR IMPLIES ANY PROFIT OR GAIN. TRADE AT YOUR OWN RISK.

Elliott Wave Options Signals - Closed EXC at 42% Profit

Closed EXC at 42% Profit

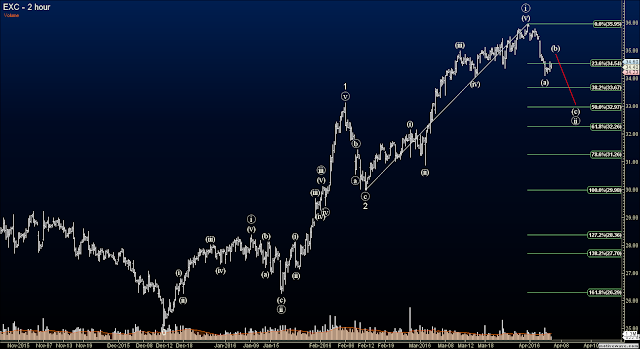
One of the few trades I've had lately that unfolded in a nice clean ABC correction.  Price has currently stopped in the middle of two Fibonacci retracement levels and is in 3 waves which tells me this wave (c) may extend lower to perhaps the 61% Fibonacci retracement at $32.26.  But it will do so without me as my target level was hit.  Here is the trade summary:

Bought EXC put spread May 20 32/35 for $1.08 and sold for $1.53 for a 42% profit.

HERE IS THE ORIGINAL TRADE SETUP:

Elliott Wave Options Signals - Exelon Corp.

Exelon Corp. shows a very weak pattern for wave (v) of ((i)) which is similar to an ending diagonal.  This type of pattern shows a tiring of the current trend and often results in a sharp reversal.  We see the start of that strong reversal with a clean five wave decline in wave (a), and it is now in a wave (b) rally phase before a sharp impulsive move lower gets underway for wave (c) of ((iii)).  Here was my trade from two days ago:

Buy to Open EXC May 20  32/35 Put Vertical @ $1.08.

Please support the blog and like this post :-)


PLEASE NOTE: THIS IS AN ELLIOTT WAVE BLOG EXPRESSING AN OPINION AND IN NO WAY GUARANTEES OR IMPLIES ANY PROFIT OR GAIN. TRADE AT YOUR OWN RISK.

Elliott Wave Option Signals - Closed BKH at 40% Profit

Elliott Wave Option Signals

Black Hills (BKH) finally made its way to my target area and is finding nice support at the 62% Fibonacci retracement level.  The decline took its sweet time unfolding in a WXY combination correction for wave (ii).  But since I had a spread, I didn't mind.  The sharp decline here is indicative of a C impulsive wave which I have as wave ((C)), but it can certainly continue lower.  However, it will do so without me as I got my pound of flesh from the market.  Here is the trade result:

Bought BKY put vertical May 55/60 $1.84 and sold for $2.57 for a 40% profit.

HERE IS THE ORIGINAL TRADE SETUP:


Elliott Wave Options Signals - Black Hills Corp (BKH)

Black Hills Corp. is in a wave (ii) within a larger bullish move.  More importantly, it is in wave c of wave (ii), which is an impulsive affair, and therefore should be quite sharp.  Using wave analysis comparing wave A to wave C, and Fibonacci retracements of wave (i), I see a confluence of support between $56 - $57, so my target will lie somewhere in that area.  I placed a put option vertical spread:

Buy to open May 20  55/60 Put

Please support the blog and like this post :-)


PLEASE NOTE: THIS IS AN ELLIOTT WAVE BLOG EXPRESSING AN OPINION AND IN NO WAY GUARANTEES OR IMPLIES ANY PROFIT OR GAIN. TRADE AT YOUR OWN RISK.

Wednesday, April 20, 2016

Elliott Wave Options Signals - Closed HMY Put at Modest 17% Profit


I closed my Harmony Gold Minding put right at the close.  It dropped over 9% and put me in the profit column on this one finally so I took the profits and ran.  Since there was not viable put spread on this stock, I could only buy a put and so every day I experience time erosion and so a 9% drop in a day is something I'll seize on.  Although I do feel this stock can easily continue lower towards the $3.00 area.

Wave X was much higher and longer than I anticipated and so it caused a delay and erosion of profits as a result, but a profit nonetheless.  Here is the final tally:

Bout HMY Put for $0.64 and sold it for $0.75 for an 17% profit.

HERE IS THE ORIGINAL TRADE SETUP:

Elliott Wave Options Signals - Harmony Gold Mining

Harmony Gold Mining (HMY) has reached buying capitulation as you can see from the sharp volume spike at the wave (1) high.  This thing has been on fire but as stalled significantly the past few weeks and triggered a bearish signal on my proprietary indicators.  The wave (2) correction is unfolding as a W-X-Y combination correction so I expect a move lower toward my target area of $2.80 - $3.00 quite over the next couple weeks.  Here is the trade I put on yesterday....it is trading at a better price now with a big gap up this morning but I expect that gap to be filled with a move downward quite soon.  I don't like any of the put spread options so I'm going with a small position on a straight put only:

Buy to Opoen HMY May 20  4 Put @ $0.64.

Please support the blog and like this post :-)


PLEASE NOTE: THIS IS AN ELLIOTT WAVE BLOG EXPRESSING AN OPINION AND IN NO WAY GUARANTEES OR IMPLIES ANY PROFIT OR GAIN. TRADE AT YOUR OWN RISK.

Elliott Wave Market Analysis


Elliott Wave S&P Analysis

The market has been choppy and flat so there's not much new to report.  Some warning signs of the bullish move are surfacing but none are confirmed, so the market may continue higher indefinitely.  The wave count looks mature on at least a short term perspective.  The market appears drawn to the 2100 level I have been targeting for months, and it should find at least a minor pullback after hitting that level.  Right now I'm just waiting for confirmation of several bearish indicators and will report them here when they surface.  Until then, I'm patiently waiting for the bulls to run out of gas.

Inter-market analysis

Another piece to consider today is the divergence between the S&P and the Russell and S&P MidCap indexes.  The S&P is outperforming the two significantly, as I assume it has a key level to achieve today of 2100.  So we'll see if this divergence holds into the close today.  Usually, when a divergence like this holds all day, it results in some pullback the next day, if not a a large bearish move.

Please support the blog and like this post :-)


PLEASE NOTE: THIS IS AN ELLIOTT WAVE BLOG EXPRESSING AN OPINION AND IN NO WAY GUARANTEES OR IMPLIES ANY PROFIT OR GAIN. TRADE AT YOUR OWN RISK.

Monday, April 18, 2016

Elliott Wave Bearish Index Signals Starting

Bearish Index Signals

For my index trading methods I look for 3 stages to confirm a trade:

1) Signal on the index
2) Signal on the VIX to confirm the index signal
3) Confirmation on proprietary indicators

Right now, states 1 and 2 have been met as both the S&P cash and the VIX have fired off bearish setup signals.  Now I'm just waiting for a confirmation move by the S&P.  Preferably, for the best trade, I would like the S&P to traverse sideways to up for a few days before triggering the signal to short.  This would provide the best profitability.  I'll post it here when the bearish signal is confirmed.  Once hit, I expect at least a 40-50 point drop.


Elliott Wave Index Count

So the head and shoulders top I projected has now failed and is removed from consideration.  I believe wave (4) is complete, although very shallow.  This means we are in wave (5) of ((3)).  In using channeling and wave ratio analysis, I see that wave (5) will equal wave (1) at 2108, and that is also close to the channel top.  I can easily see the market getting to 2100-2110 and then reversing short of the upper channel line.  I will rely on my proprietary indicators to identify when a top has occurred though, and when I should short.  Until then, I will patiently wait.

Please support the blog and like this post :-)


PLEASE NOTE: THIS IS AN ELLIOTT WAVE BLOG EXPRESSING AN OPINION AND IN NO WAY GUARANTEES OR IMPLIES ANY PROFIT OR GAIN. TRADE AT YOUR OWN RISK.
StatCounter