Thursday, August 5, 2010

Volume has Fallen off a Cliff; Waiting for Jobs Number Friday


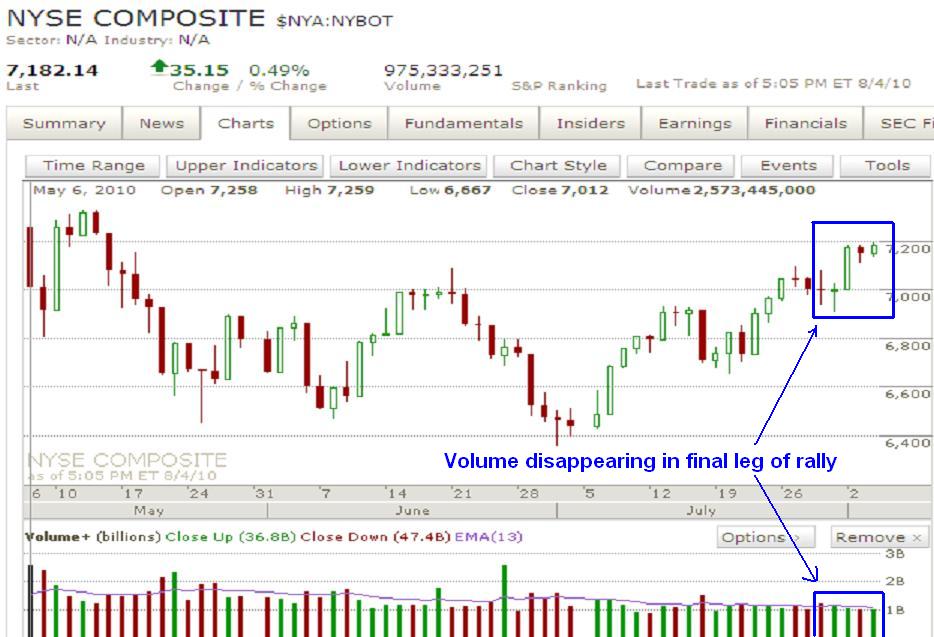
Volume continues to fall off a cliff as today's NYSE volume was well under 900 million shares. The market should give way soon to a sharp drop to at least the 1100 level in the S&P, but possibly much lower. It seems that folks are waiting for the big jobs number coming out tomorrow. So after the number is released, the market's volume should return a little bit and get this market moving in line with the larger trend. I feel that the rally over the past few weeks is at its ending stages and will roll over at any time. A sharp rally based on the jobs number tomorrow would be a great opportunity to get short as long as all the other indices listed below remain below their June highs. The flat sideways action the past couple days suggests this is a 4th wave we're in and so a final sharp 5th wave rally before reversing violently may be in order. It doesn't have to shoot higher, and the S&P futures chart below is evidence of that. But tomorrow's jobs number has good prospects of giving us solid ground action to help us going forward.


The S&P futures made a nice 5 wave decline and a correction that is about at the maximum comfort level for a retracement at the 78% fibonacci level. So as long as the overnight high here remains in place, it's possible a top is already in and major selling is on the horizon.


Again, the various indices are quite fractured, with the Russell 2000 and Nasdaq Composite now lagging drastically compared to the Dow. Although the market hasn't tanked hard yet after such a pronounced divergence between indices, the fact that they've remained divergent for so long is still quite bearish in my view.

I remain bearish in the short term as I aggressively look for a top and reversal that should take the S&P down to at least the 1100 level in a hurry.


PLEASE NOTE: THIS IS JUST AN ANALYSIS BLOG AND IN NO WAY GUARANTEES OR IMPLIES ANY PROFIT OR GAIN. THE DATA HERE IS MERELY AN EXPRESSED OPINION. TRADE AT YOUR OWN RISK.

Wednesday, August 4, 2010

Not Much Changed From Yesterday; Market Still on Verge of Reversing


The market didn't do much today so nothing has really changed in the outlook from yesterday. The Nasdaq Composite and Russell 2000 still have not made any new highs to confirm those in the NDX, Dow and S&P. As long as those divergences remain in place, the bearish potential is great.

Above is a better illustration of the wedge formation I mentioned yesterday. In EWP, they usually are "leading diagonals" or "ending diagonals". Both are weak structures and the ending diagonal is a finishing move, which can form a wave C which might fight nicely here, and result in sharp reversals. Whether or not this particular wedge falls right into perfect EWP form or not, the structure of the rally in this manner is a weak one, and it's exhibited in several intraday momentum indicators. When the market does finally pull back, I expect the S&P to get to at least the 1100 level in quite a hurry. And with volatility so low right now, I put a very small short term put option position that I will either cash out on a sharp decline and VIX spike, or will just let it run out and expire worthless.


Above is a daily volume chart of the NYSE Composite. Today's internals on the NYSE were quite strong however volume was so light, less than 1 billion, that I'm not sure how reliable that strength was. You can see above that after that July 29th down day and volume spike above the 13 day moving average, the market has gone to new highs but volume continues to fall further and further away from the 13 day moving average. So this latest rally leg higher in the S&P since July 29th is quite shallow in strength and conviction and so I feel it will be completely reversed rather quickly.

Friday is the all important jobs number so perhaps traders will just wait until late Thursday and Friday morning to take bigger positions and get some volume back in this market. A short pop higher might occur before a top is in, but the evidence suggests a sharp move to the downside coming soon that should quickly test the 1100 level in the S&P.


PLEASE NOTE: THIS IS JUST AN ANALYSIS BLOG AND IN NO WAY GUARANTEES OR IMPLIES ANY PROFIT OR GAIN. THE DATA HERE IS MERELY AN EXPRESSED OPINION. TRADE AT YOUR OWN RISK.

Tuesday, August 3, 2010

Market Should be Ending Rally


There was no follow through to the big rally yesterday. Today's internals were quite negative in both the NYSE and S&P as you can see above. Although volume was very low, and well beneath the 13 day moving average. But I too see this as bearish since we did have a huge rally that seems to have surprised a lot of folks and give the "all clear" sign for the market to get back in bull mode I'd expect to see a big spike in volume as the masses rush back into stocks. But volume was also well below the 13 day moving average on yesterday's huge rally, then was even less today. That's not very bullish in my view. And in fact, volume has been declining ever since July 29th, which was the last time the 13 day moving average was breached, and that was a down day. So since then, we've had declining volume, yet the market has worked higher. This is the characteristics that accompany a top. Which I feel is at hand, or very close.


Above is a 2 hour chart of the S&P cash index and RSI momentum indicator. You can see that the evidence of a weak rally is also strong with this data as well. You can see that the rise the past few weeks looks a lot like a wedge, which is typically a weak structure; whether it be part of a wave C ending diagonal or leading diagonal, a sharp and deep reversal should be coming soon. In addition to this wedge structure, the weakness is also illustrated with the fact that price has made two higher highs so far, and yet the RSI has made lower highs, not confirming the rise in price. Again, this suggests that this market is topping and a sharp reversal is coming soon.

Although this evidence is not good as far as timing the market reversal, I'd say that the easy money for the bulls is over, and I think it's time to try and start getting short when opportunities arise.


And lastly, it's quite clear on the daily charts above that the Dow is leading the surge higher while other indices are lagging. And the higher the risk in the index, the further back its lagging. I posted some charts this morning comparing the Dow to the other indices' highs from back in late June. Well also notice that as of today's close, the Nasdaq Composite and Russell 2000 have not even been able to exceed their July 27th highs, with the Nasdaq 100 barely exceeding it. This behavior is bearish as long as it remains in place. When you combine the fact that other indices are lagging the "cream of the crop" Dow index, and that volume in the market is declining, it seems that interest in this rally and the bullish side is fading big time.

Now a big rally on strong volume that brings all these indices above their June highs and gets new highs registered on the RSI will negate all this topping bearish view. But as long as the evidence does remain intact, I view the market as bearish. The small waves of the yesterday and today suggest a possible small 4th wave triangle forming. If correct, we should get one more sharp thrust higher. But thrusts are terminal moves and completely reversed in fast order. And considering the evidence I mentioned above, signs of a "finishing move" like a thrust from a triangle would be a great opportunity for the bears to get short again, in my opinion.

PLEASE NOTE: THIS IS JUST AN ANALYSIS BLOG AND IN NO WAY GUARANTEES OR IMPLIES ANY PROFIT OR GAIN. THE DATA HERE IS MERELY AN EXPRESSED OPINION. TRADE AT YOUR OWN RISK.

Dow Breaking New Ground on its Own


Just a quick midday note since I was unable to put up a post yesterday: The market surged big yesterday, but it was mostly the Dow that made the major headway. If the Nasdaqs were leading the charge higher, I'd be looking more at the bullish side for a larger and longer sustained move to the upside. But the Nasdaqs are in fact lagging the worst of the major indices compared to the Dow. This often means that there is some fear underlying the market as people are only willing to buy up the big blue chip "safe" stocks and avoid the higher risk tech stocks. That's not the behavior I'd expect to see at the beginning of a new bull run. This combined with the fact that the entire rise from the July 2 low is now looking like a wedge, which is a corrective pattern, makes me believe that the market still needs to make new lows on the year. As long as the Nasdaq 100, Nasdaq Composite and S&P 500 stay below their highs, I think the risk:reward potential favors the bears who still have a slight edge in my opinion. If those indices to make new highs, then it would turn me neutral for the short term.

More later after the close.


PLEASE NOTE: THIS IS JUST AN ANALYSIS BLOG AND IN NO WAY GUARANTEES OR IMPLIES ANY PROFIT OR GAIN. THE DATA HERE IS MERELY AN EXPRESSED OPINION. TRADE AT YOUR OWN RISK.

Sunday, August 1, 2010

Big Move Coming


The market is flip flopping all around, confusing even most of the pros out there who seem to recommend "getting smaller" in this market because it's so tough. The VIX is quite low and could signal complacency in the options market which can often mean a major top in the stock market is occurring. The behavior of the market with it's wide directionless swings the past week or so signal that a major move is coming. Seeing as that it's possible we're at the top end of a trading range which is around 1113, the wave count suggests that a wave 3 at various degrees might be getting started, a series of new lows and highs has started on the 15min charts, and that the VIX is at levels of complacency that has marked major stock market tops before, I'm going to give a slight advantage to the bears. This means that this "big move" in the market should be to the downside.

What sticks in my head when I see these charts is the Dow's new high that was not followed by the S&P or Nasdaqs on Thursday, then the Dow's reversal to close beneath the open from the day before. This is a topping reversal pattern. With that in mind I can rest assured that the bearish side should be favored as long as that high in the Dow is maintained at 10,463, no matter what the wave structure might be; the short term should should favor the bears. So I'm short term bearish as long as the Dow trades below 10,463.


But all is not perfect, that's for sure, for the bears. The decline from the 10,463 high is not impulsive looking at all. That doesn't mean the market won't tank hard from here, but it's not a good start for a big decline from an elliott waver's perspective. Also, on the above 15min chart, it looks like the market MIGHT have failed to make new lows with that latest drop then sharp rally. It created what looks like an inverse head and shoulders pattern, which is of course very bullish. But the pattern was not completed as the market failed to close above the neckline and instead reversed into the close. So it's inconclusive, like many other things in this market right now.

Despite the bullish potential, the Dow is not far away from the 10,463 level I just mentioned earlier. I think it's safe to stay bearish with a stop just above that level. A strong shot through that level would negate that topping reversal pattern and therefore severely weaken the short term bearish case. Depending on the strength and structure of that rally I would consider getting long since we might be in a wave 3 at various degrees to the upside. But the rally must be sustained, because another shot higher that's reversed would be even more bearish. At this point, a short term trader needs to be very vigilant and nimble. I can't emphasize that enough right here.

I remain short term bearish as long as the Dow trades below 10,463.


PLEASE NOTE: THIS IS JUST AN ANALYSIS BLOG AND IN NO WAY GUARANTEES OR IMPLIES ANY PROFIT OR GAIN. THE DATA HERE IS MERELY AN EXPRESSED OPINION. TRADE AT YOUR OWN RISK.

StatCounter