Thursday, November 17, 2011

Bye-bye Mr. Triangle, Stocks and Euro Headed Lower


I have said that I'd like to see the market pick up in volume, to at least 1 billion NYSE shares, and the 1225 level in the S&P be broken in order for me to remove the triangle count and put the aggressively bearish top count up as a far out first choice.  Well, we got both of those things with today's action.  There's still some risk to the short term bearish view with Thanksgiving week right around the corner, but I listen to the charts and internal behavior of the markets more than a loose historical seasonal bias.  The typically bullish week we are about to embark upon should be considered as a part of the overall trading strategy, but in my opinion it shouldn't be the sole reason for making a trade.

From Elliott Wave International, Download "The Most Important Investment Report You'll Read for 2012" Now. (It's FREE until November 30.)


Above is the top count and it is aggressively bearish and means the market should unfold sharply lower in the coming weeks.  Yesterday I eluded to Elliott Wave International's "Short Term Update" bringing an issue related to the triangle.  At the time I didn't want to divulge proprietary information, but now that the triangle is broken I'd like to explain further.  The Short Term Update brought to light an issue that contradicted the likelihood of the triangle scenario playing out.  They (Steve Hochberg) stated that yesterday the Wall Street Journal published a story that an extremely bullish triangle formation was in place.  So of course, the contrarian method of thinking is that if the Wall Street Journal is reporting a bullish triangle is in place, then that means it's a pretty mainstream thought and therefore it most likely will NOT occur.  In yesterday's post, I eluded to Hochberg's statement because I thought it was the strongest piece of evidence against the triangle interpretation.  It turns out Hochberg was very wise to post that analysis yesterday.  The triangle scenario has been eliminated, and the EWP structure suggests the market will head sharply lower soon.

What Are the BEST Technical Indicators for Successful Trading?


The euro rally has been very flat and filled with 3 wave moves as it only progresses sideways as you can see from the above chart.  This is clearly corrective and suggests the euro will head lower soon.  And remember, the last few years I can remember, the euro has been sold off hard during Thanksgiving week.  Like I said for stocks, I don't think these types of historical seasonal biases should be traded on solely, but they should definitely be considered.

Learn Elliott Wave Principle


PLEASE NOTE: THIS IS JUST AN ANALYSIS BLOG AND IN NO WAY GUARANTEES OR IMPLIES ANY PROFIT OR GAIN. THE DATA HERE IS MERELY AN EXPRESSED OPINION. TRADE AT YOUR OWN RISK.

Wednesday, November 16, 2011

Thursday Should Eliminate One of the Two Top Counts; Euro Trend Remains Down


Internals flipped bearish with the declines today and volume increased as well.  915 million NYSE shares traded today which is a strong increase from when the market was pushing higher, however in the big picture this is still fairly weak.  It instills confidence in that in the longer term picture, the trend is still down, but for the short term I'm not sure this lends itself to the start of a wave 3 at various degrees.  But we'll see.

From Elliott Wave International, Download "The Most Important Investment Report You'll Read for 2012" Now. (It's FREE until November 30.)


Again, the top count above is very bearish.  It suggests wave iii of (iii) of 1 of (3) of ((3)) is underway.  Unfortunately, I wouldn't expect to see such deep and long lasting corrective rallies for this structure, and I'd also expect volume to be surging with the declines.  Perhaps the holiday season malaise is already kicking in, but who knows.  The alternate triangle count comes in a very close 2nd but could be eliminated early tomorrow on a break below 1225.  If the triangle is eliminated, then this count above holds strong footing and will be used as a basis for all my trades for the foreseeable future.

What Are the BEST Technical Indicators for Successful Trading?


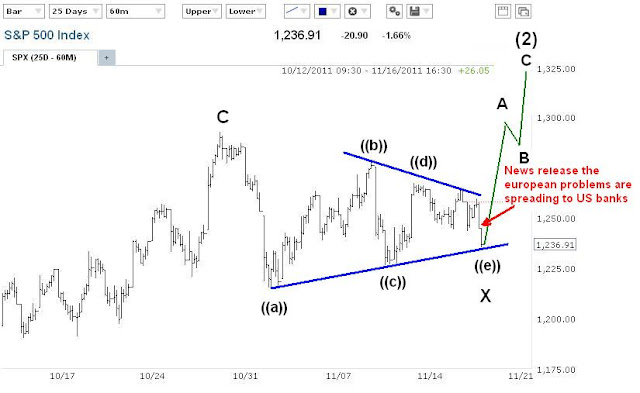
The alternate triangle count is listed above.  You can see that it's fitting quite nicely into a good consolidative triangle pattern that should be finishing up right now.  The result of this triangle is of course a sharp surge higher to a new high which will then be quickly and completely reversed.  Another strong piece of evidence for this count is how prices reacted to the news that came out about US banks worried that European problems might affect them.  The market sold off sharply in conjunction with this news.  EWP states that E waves of triangles often are the result of some news event, but are the last move of the triangle and result in sharp reversal thrusts to new extremes.  Well the news event about European and US banks led to a decline that fits well for wave ((e))'s placement in the triangle count and it means that early tomorrow the market will undergo a large and sharp thrust higher to above 1300 at a minimum.

A sharp move higher on solid volume would put this count as top choice and give wavers a good opportunity to start establishing short positions above 1300 in my view since thrusts from tirangles are finishing moves are quickly and completely reversed.

A break below 1225 would pretty much erase this count from contention and put the first bearish count post at the top as the best viable count.  For those of you who subscribe to EWI's Short Term Update you saw what Steve Hochberg had to say about the triangle scenario and I feel it's very compelling myself.  It's also a big reason I have the two counts listed the way they are.

Learn Elliott Wave Principle


After a nice clear ABC rally with a B wave triangle in the middle and a C wave that stopped around 78% fibonacci, the euro did what was expected, it fell to a new low.  The euro continues to decline impulsively and rally correctively (3 waves).  I see no reason to abandon the bearish stance here.  I remain short this pair.


PLEASE NOTE: THIS IS JUST AN ANALYSIS BLOG AND IN NO WAY GUARANTEES OR IMPLIES ANY PROFIT OR GAIN. THE DATA HERE IS MERELY AN EXPRESSED OPINION. TRADE AT YOUR OWN RISK.

Monday, November 14, 2011

Stock Triangle PIcking up Traction; Euro to Correct Higher, then Fall Hard Again


Internals suggest that the usual market participants had better things to do today.  Only 709 million NYSE shares were traded today, surely one of the slowest trading days of the year.  When you combine this with the price action it lends itself more to the triangle alternate count I mentioned yesterday.  With Thanksgiving coming up next week, a week that's typically good for stocks, it's possible we might just float around in a net sideways-to up market for the next couple of weeks.

America's First Deflationary Depression: Is a Bigger One Ahead?


With volume so light on today's move, it would seem more likely that today's weakness was corrective, and that a new high is still on the way.  But seeing as that the correction from the Wave i low would be getting quite elongated, along with the unorthodox look of wave (iii) down that's supposed to be underway right now, it means this count is losing steam.  If this count is on track still, I'd like to see a sharp and quick pop to a new high tomorrow followed by a sharp reversal, or the market just fall hard with solid volume (above 1 billion NYSE).  Anything other than that would lend itself more to the below triangle scenario, or perhaps something else entirely.


The sideways action over the past month or so, along with decreasing volume numbers, fit well into the triangle scenario shown above.  If so, this would fit somewhat nicely into the upcoming holiday malaise we should see for the next week or so.  I think tomorrow's price action and internals will be very telling on which of the two above counts are most likely in play.

Learn Elliott Wave Principle


One of the reasons the more bearish count is still my top choice at the moment is the wave count in the euro.  The euro appears to have topped and reversed again aftern an exhaustion gap up from Sunday.  The resultant decline looks impulsive, again furthering the case for a top and bearish reversal.  Yet stocks did not follow the euro's intensity to the downside today.  This tells me that perhaps the upcoming corrective euro rally with fall short of making a new high, yet stocks might make a slight pop up to a new high before reversing, creating an intermarket divergence I would see as very bearish.  So I still think it's better to be short the euro here.  And aside from stocks, the past few years the Thanksgiving holiday has been very bad to the euro and great for the US dollar.  If that holds true again this year, it means heavy selling is just ahead for the euro, and the wave count above supports this outlook.


PLEASE NOTE: THIS IS JUST AN ANALYSIS BLOG AND IN NO WAY GUARANTEES OR IMPLIES ANY PROFIT OR GAIN. THE DATA HERE IS MERELY AN EXPRESSED OPINION. TRADE AT YOUR OWN RISK.

Sunday, November 13, 2011

Volume Numbers Continue to Suggest the Stock Rally is Corrective; Euro Topping


From an EWP perspective the rally is getting very deep.  After a nice top and reversal for wave (ii) at the 78% fibonacci retracement level of the previous decline we got a very nice and sharp selloff which was encouraging for the bears.  But the ensuing rally has gone quite deep, yet has not made a new high.  Therefore the above count remains valid.  But I expect a top to be in now, or with just one more quick pop higher tomorrow morning before the heavy selling returns.  But that "pop" higher is not necessary, looking at the euro we may get immediate weakness right at the open tomorrow.  Either way, the risk/reward favors the bears here.

The count on the back burner is the possibility that a triangle is forming which means Intermediate wave (2) is not complete, and that the larger downtrend has NOT resumed.  This would also be another explanation for the decreasing volume the past few trading days.  I don' t see this count as top choice right now though, but with the holidays approaching and the weak volume right now and sideways price action, this count is gaining traction as a strong possibility.  A break above 1277 would put this triangle alternate on the table.

Learn Elliott Wave Principle


Volume supports the EWP count in that last week's rally has been on severely weakening volume.  As I hinted in my last post, the Veteran's Day holiday Friday brought the market a nice rally but did so on weak volume at only 745 million NYSE shares.  So the masses aren't taking part in the rally, at least not yet.  So for now, price action relative to volume gives a bearish outlook for stocks right now. 

America's First Deflationary Depression: Is a Bigger One Ahead?


The euro looks to be topping here.  Using basic EWP analysis it appears a nice ABC correction is complete with wave B being a triangle.  Although I don't have a longer term count that's reliable, it doesn't mean we can't us EWP basics to get a good idea of the shorter term action.

The 78% fibonacci retracement of the previous decline has been reached and slightly exceeded, making it the preferred maximum retracement possible to still reliably count this rally as a correction.  The fact that the RSI and stochastics diverged on the recent new high at today's gap open, and that it looks like an exhaustion gap since it was immediately reversed after a big rally, the euro may be topping here.  I'm looking for the euro to head sharply lower now and the risk here is tight, i.e. either at today's high or 1.3860.

PLEASE NOTE: THIS IS JUST AN ANALYSIS BLOG AND IN NO WAY GUARANTEES OR IMPLIES ANY PROFIT OR GAIN. THE DATA HERE IS MERELY AN EXPRESSED OPINION. TRADE AT YOUR OWN RISK.

StatCounter