Friday, November 20, 2009

Watching the Dollar for Signs of Stock Market Break Down


As I've been saying for weeks, the key to the stock market rally appears to be the decline in the dollar. As the dollar has fallen, stock prices have rallied. The euro/US dollar, or EUR/USD, is basically the "anti-dollar" and moves opposite the US dollar. So the EUR/USD essentially moves fairly parallel to the stock market. So watching the EUR/USD for signs of a top and break down will give us clues as to when the stock market will top and break down.

Notice on the 4hr EUR/USD chart I have above that the pair has consistantly failed to make a new high recently, despite the Dow and Nasdaqs doing so. Again, another non-confirmation bearish divergence in the markets, indices, and sectors that normally move fairly in line with each other. But more importantly, look at the series of lower highs and lower lows being formed in the very choppy sideways action in the EUR/USD. The market is telling us that the 1.4800 level is VERY important because whenever the pair reaches that level it gets bought up ferociously. But it still keeps inching out new lows before rallying, which ultimately has failed to make new highs. What this probably means is that the bears are slowly and steadily gaining the upper hand here because the bears push the pair down to new lows and then stop a rally to new highs. The more it hits the 1.4800 level, the more erosion to the bulls' support will occur there until eventually there's nothing left. As long as this continues, it's just a matter of time before that support barrier gives way and the EUR/USD collapses. Once that happens, it should move quickly to at least the 1.4650 area before finding support again. So many people are short the dollar and long the EUR/USD that once these people exit, the move will be "jaw-droppingly huge and fast".

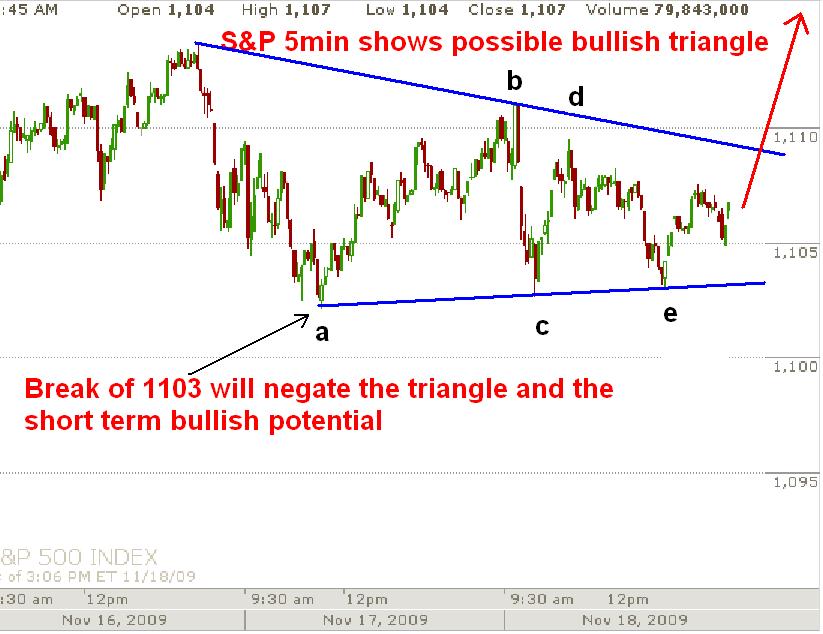
When the EUR/USD breaks down, the stock market will follow. The stock market appears to be falling in 5 waves, but probably needs one more "up-down" sequence for the waves to count properly. Otherwise it leaves open the possibility that the entire decline was just an A-B-C drop as shown in red on the attached 15min S&P cash chart.

Thursday, November 19, 2009

XLF and Russell Splitting Off to the Downside, Dow Trying to Hold up but Legs are Wobbling


The market improved slightly since my post this morning. NYSE decliners outpaced advancers 4.33 to 1, down volume was 88% of total volume, and 465 stocks on the S&P closed down. So today was a broad based 'sell-everything' decline. Volume looks like it's going to be around the 13 day moving average, so nothing stellar there. The Dow managed a solid rally into the close, making it seem like the stock market wasn't really that weak today. However, the Dow surged mostly all by its lonesome. Here are the finishing stats:

Dow -0.89%
S&P 500 -1.34%
Nasdaq Comp -1.65%
XLF -1.94%
Russell 2000 -2.34%


So today really was as bad as most people thought. Again, the Dow is surging higher while the rest are peeling away. Look at my 3 month comparison chart that shows the Russell 2000 and the XLF severely lagging the Dow's rally, with the Nasdaq and S&P tagging along. Also notice that even the Nasdaq and S&P are starting to fade a little bit and not following the Dow so aggressively. This is topping behavior as long as it exists. And it doesn't appear to be ending soon. Take a look at my 4 separate charts comparing the Dow, S&P, Russell and XLF. Today's late afternoon Dow pop rally was not so enthusiastic in the other indices. I know this is only the 5min time frame but you can see that on the bigger time frame charts going back to the 2007 top where I showed the splitting of the indices, to today's 3 month chart of the indices splitting, and down to the 5min chart where it shows even more splitting that a major top is forming as the high risk indices and sectors are leaving the but wave 2 or B rally early. The key is that this is telling us a MAJOR top is forming right now because investors only feel safe in buying the blue chip Dow and S&P stocks right now. This occurs at the end of major uptrends when they form a top, not at the start or middle of bull markets. If it were a bull market, the XLF, Russell and Nasdaqs would be the ones leading us higher, not the blue chip Dow.

There are various ways to interpret the short term wave count so I won't create the clutter on a chart listing them all. Since I'm looking for a major top I will assume a 5 wave decline is underway and the rallying most of the latter part of the day is a wave 4, meaning a sharp wave 5 to lows beneath today should occur fairly quickly tomorrow morning. Tomorrow is options expiration day so I expect some volatility as people jostle the market and reposition themselves for the next month/quarter.

Watch the action in the US dollar this afternoon and throughout the night to get a clue of where the market may head tomorrow. A strong dollar, weak EUR/USD, means the wave 5 down to new lows scenario is on firm footing. I remain short term bearish against the 1111 and 1114 levels as well as long term bearish. I'm not calling "the top" in yet, but it appears some sort of top is in that should last a few days/weeks at least.


PLEASE NOTE: THIS IS JUST AN ANALYSIS BLOG AND IN NO WAY GUARANTEES OR IMPLIES ANY PROFIT OR GAIN. THE DATA HERE IS MERELY AN EXPRESSED OPINION. TRADE AT YOUR OWN RISK.

Bullish Triangle Eliminated, Internals Extremely Weak; Some Degree of Top is in


Ah, finally some market movement that gives me something to write about finally. Yesterday I showed the consolidation of the market and labeled it as a possible bullish triangle. Triangles are great to trade because you know exactly where you're right and wrong. The break of 1103 negated the triangle and opened up immediately bearish potential.

As I've been stating for days the market appeared "toppish" due to several indicators supporting a severe weakening in the uptrend, especially the light volume accompanying it. Today we have a sharp selloff with extremely weak internals, see the data posted above: NYSE is trading an amazing 7.64 stocks down for every 1 trading up, 94% of total volume is to the downside, and the S&P has 486 decliners to only 13 advancers. This appears to be some of the weakest and most broad based bearish internals I've seen in a long long time. It seems that with every selloff the intensity and internal weakness has been increasing. That's long term bearish and should give the long term "recovery" bulls some serious reconsideration of their positions.

You can also see on my 30min S&P cash chart that the market completed a 5 wave rally preceding this selloff. The 5th wave would have counted better with one more high, however the Dow actually did make that new high, which in effect created a bearish divergence between the Dow and S&P that was not resolved and the market sold off. Again here's another example of the fracturing that occurs at market tops. See my post here discussing the bigger long term fracturing occuring right now. On a much larger scale, we currently see this fracturing in the Dow and S&P versus the Russell 2000, XLF, DJ Transports, etc.

So the key question is whether or not this is "the top". Unfortunately I don't know yet. We need to see further break downs of key levels accompanied by high volume and weak internals. What I can say is that some degree of top is in now and that 1111 and 1114 should hold for at least a few days. The first test of this decline will be the previous 4th wave which according to EWP is oftentimes a support level for corrections. If the market just blasts right through this level at 1085, it will hint that this decline may be more than just a correction. The next bigger test will be a break and hold beneath the 1060 level. That will definitely get my attention and perhaps give confirmation that "the top" is in. Hopefully I'll be able to identify "the top" sooner than that though.

So I'm now short term bearish as long as the market stays below 1114 in the S&P cash index. And of course I remain long term bearish.

More later.


PLEASE NOTE: THIS IS JUST AN ANALYSIS BLOG AND IN NO WAY GUARANTEES OR IMPLIES ANY PROFIT OR GAIN. THE DATA HERE IS MERELY AN EXPRESSED OPINION. TRADE AT YOUR OWN RISK.

Wednesday, November 18, 2009

Possible Bullish Triangle in S&P About to Explode Higher


Just a quick heads up. The sideways consolidating action in the S&P looks like a triangle which occurs in the 4th, B and X waves. This would most likely be a 4th wave triangle which will be followed by a 5th wave "thrust" to new highs. Thrusts are terminal moves are quickly reversed. A break of the wave "a" low at 1103 would negate the triangle and the short term bullish potential. So hypothetically if I were to do a short term short position, I put a sell stop below 1103 just in case the triangle scenario unfolds. Or if I wanted to get long I might go long now with a stop just below 1103. But I'm still short term neutral myself, until the market gives evidence that a top is in, at any degree.


PLEASE NOTE: THIS IS JUST AN ANALYSIS BLOG AND IN NO WAY GUARANTEES OR IMPLIES ANY PROFIT OR GAIN. THE DATA HERE IS MERELY AN EXPRESSED OPINION. TRADE AT YOUR OWN RISK.

Tuesday, November 17, 2009

Market Looking Toppish - Wednesday Should be Interesting


There are a few things to go over today, and most of them have me conclude that the market is topping, or may have topped today. At what degree that top is will be determined by the ensuing decline. Let's run down the supporting evidence:

1) the NYSE/Dow signal executed today with the Dow closing up while the NYSE closed modestly down. Last time this occured it was on a week of very low volume, the following day was a holiday (Veteran's Day), and as the market was rallying to new highs, so it didn't work until the day after the holiday where we had a selloff. Normally this signal works when the market is in a downtrend, or at the forefront of one. So we'll see if tomorrow proves this signal reliable again with some heavy selling.

2) Monday I illustrated the unusual activity in the US dollar through the USD/CHF (see chart here). This smells of distribution where institution(s) cover their short dollar positions, repatriate their dollars to the US, or simply establish a long dollar position. This was big movement in the currency and it should be noticed that following it we had a stronger rally making a new high today. Look at my attached Euro/US Dollar chart at the 2 hour timeframe. This pair moves opposite the US dollar essentially so this pair basically should move in line with the stock market. The key to the US stock market holding up is the US dollar. So watching for a EUR/USD breakdown can give us a good idea of when the stock market is going to break down. Well observe on the EUR/USD chart that the recent rally did not make a new high, and today's selloff made a new low. So we now have 2 failed attempts at new highs on the daily chart and now we have a new low. This is how downtrends start. If the EUR/USD is breaking down, then the stock market should soon follow. This in and of itself may not be that big of deal, but when combined with all the other "toppish" indicators occuring right now in the stock market, it's something to watch closely.

3) The Dow made a new intraday high today, and closed at that new high while the S&P did neither as you can see from my two charts attached. Yesterday's post had a wave count that required one more new high before completing 5 waves up, and some sort of top forming in the S&P (see post here). Well today's Dow high may have satsified that requirement, or may do so with the S&P popping to a new high quickly tomorrow morning. Either way, today's non-confirmation between the Dow and S&P is bearish when combined with all the other evidence at hand, and will remain so until the S&P confirms a new high with the Dow.

The only kink in the armor in the very short term is the fact that the structure of the decline from late Monday does not look impuslive in the S&P and other indices which suggests it's just a correction and new highs are coming. However these highs should be 5th waves and reversed quite quickly. So my position now is that a top is forming at some degree, but I can't call a top and reversal until I get confirmation which I don't have yet. So I remain short term neutral at this time.

PLEASE NOTE: THIS IS JUST AN ANALYSIS BLOG AND IN NO WAY GUARANTEES OR IMPLIES ANY PROFIT OR GAIN. THE DATA HERE IS MERELY AN EXPRESSED OPINION. TRADE AT YOUR OWN RISK.

Monday, November 16, 2009

Short Term Wave Count Suggests Some Degree of Top Approaching Very Soon


Friday I posted my primary short term S&P cash count (see post here) showing an a-b-c correction and a big rally about to occur. My alternate count was bearish, but required a break of 1085 to put it as my primary count, which didn't happen. Today the market played out the primary count's objective and rallied sharply higher. As you can see from my update chart today, I'm counting the 4th wave as a "flat correction", meaning we have one more rally leg for wave 5, and to complete the rise from 1085. 5th waves are tricky and often don't unravel perfectly, so it's possible with today's late session weakness that this 5th wave is already complete, and top at some degree is in already. Either way, I've closed my short term call options at a profit anyway. Early tomorrow we should know if a top at some degree is in, or if we have one more pop before doing so.

Internals today were very strong and up volume was very strong at 87% of total NYSE volume. The Russell surged and broke last week's high, but not the daily key daily high illustrated in prior posts. The XLF on the other hand, is lagging big time, and is showing signs that it's in its bear market wave 3 or C already. After falling in 5 waves late last week, the XLF rallied to the fibonacci 78.6% retracement level today then sold off sharply late in today's session. It did not follow the other main indices in a new high from last week. More evidence that this market is struggling to pull "everyone" higher to new highs as I discussed in this weekend's post (click here for post).

As long as these divergences on various time frames and with various indices/sectors remain in place, my conclusion is that we are in a major topping process in the stock market that will result an a huge and powerful wave 3 or C decline lasting several months at least. Right now I don't see any signs of a top yet so I can't become short term bearish at this point, so I remain neutral in the short term until evidence of a top presents itself. But with the short term wave count in its final stages, it appears some degree of top is fast approaching.


PLEASE NOTE: THIS IS JUST AN ANALYSIS BLOG AND IN NO WAY GUARANTEES OR IMPLIES ANY PROFIT OR GAIN. THE DATA HERE IS MERELY AN EXPRESSED OPINION. TRADE AT YOUR OWN RISK.

Market Surges Higher, So I Closed my Short Term Call Positions


Today the market surged higher and appears to be in the tail end of a 5 wave impulse rally on the hourly charts, and quite possibly a "blowoff top" in the larger picture. Whether this will complete the entire rise and make a top or if it's just part of a larger move up I don't know at this point. With the quick gains I made in my call option positions on the rally from last several days I decided to close those short term call positions at a profit like I said I'd do on a rally in my last post. The internals are very strong today and the US dollar continues to weaken, all fueling the big rally today. Some interesting behavior occured though, where the dollar sold off about 100 pips in a short period of time then rallied to a high above it (see attached chart). This looks distributive, much like the behavior in the stock market, where big institutions are moving out of positions and into safer assets. Silver voided that sell signal I mentioned the other day and has surged an amazing 5% today making a new high and confirming gold's rise, at least on the daily charts. The Russell 2000 made a new high above last week's already as well, but not a new high above the key level I've been discussing here.

There is no end in sight to the rally at this point. Until weakness resurfaces, I'm still short term neutral.


PLEASE NOTE: THIS IS JUST AN ANALYSIS BLOG AND IN NO WAY GUARANTEES OR IMPLIES ANY PROFIT OR GAIN. THE DATA HERE IS MERELY AN EXPRESSED OPINION. TRADE AT YOUR OWN RISK.

StatCounter