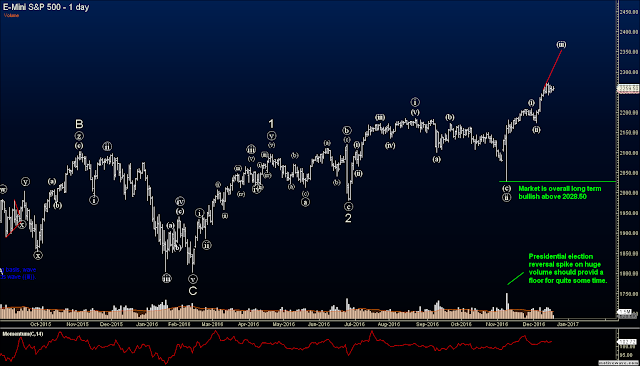
The market has held up well the past week or so and my wave count remains intact. It looks like a fourth wave consolidation is occurring and a shot higher will ensue shortly. I don't see any big action occurring until the New Year, but a steady float higher should occur up until then.
The US Dollar appears overbought, along with all the Japanese yen pairs, so short term selling of the USD and buying of JPY might be wise when a technical setup coincides with those directions. I would remain nimble and flexible with the trades and view them as short term corrective opportunities as they are Fed related moves leading up to this point. Long term, they should continue in their current directions, but short term they are due for a correction.
Here is a snapshot that drills down the wave count a little more from the daily chart. This 4 hour chart shows a strong rally that should continue to the 2400-2450 area before any meaningful correction. There are multiple alternate counts that also conclude at the 2400 level as well, so that level appears be a good place to look for a solid correction.
Please support the blog and like this post :-)
PLEASE NOTE: THIS IS AN ELLIOTT WAVE BLOG EXPRESSING AN OPINION AND IN NO WAY GUARANTEES OR IMPLIES ANY PROFIT OR GAIN. TRADE AT YOUR OWN RISK.

