Thursday, August 26, 2010

....and Again, the Larger Trend Remains Down


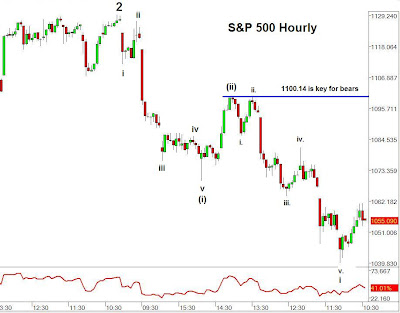
I thought that the market was in either a "B" or "X" wave when the market started to decline later in the day. This would mean another strong rally higher, well into the 1060 - 1081 zone I mentioned in last post. But the last 30 minutes of trading erased that from being a high probability. The market sold off sharply suggesting that perhaps wave ii of (iii) has already topped and now wave iii of (iii) of 3 of [3] or C is now underway. Obviously there should be little doubt this is occuring since a wave at this degree would be almost a straight line down. So a sharp shot lower beneath 1039.83 should confirm that this is indeed occurring.

It is possible that a flat correction could take place with a break of 1039.83, but if it's a sharp shot down on the heels of today's sharp shot down into the close, it would mean that a flat correction is not a high probability.


Above is the alternate count which is also quite possible. This short term bullish count suggests that the decline later in the day was either a wave B or X of a wave ii correction. If so, I expect the market to charge higher into the 1060 - 1081 range before wave ii tops. A sharp decline beneath 1039.83 would make the count suggesting wave ii is still underway very unlikely.

PLEASE NOTE: THIS IS JUST AN ANALYSIS BLOG AND IN NO WAY GUARANTEES OR IMPLIES ANY PROFIT OR GAIN. THE DATA HERE IS MERELY AN EXPRESSED OPINION. TRADE AT YOUR OWN RISK.

Larger Trend Remains Down


So my little hunch the last post about a short term bottom forming proved correct with yesterday's bounce that pushed into this morning. But that's about it so far as the market looks challenged here. Right now the market sports a 3 wave rally off the 1039.83 low, so the correction could be complete. But if the market gets above today's high at 1061.45, then I'm looking for a charge to the 1063 - 1081 area, part of which would fill a gap left open from a prior 3rd wave.

The bottom line is that the larger trend remains down, the market is unfolding in nice 5 wave impulsive declines. And as long as 1100.14 remains intact, I'm shorting into rallies.


PLEASE NOTE: THIS IS JUST AN ANALYSIS BLOG AND IN NO WAY GUARANTEES OR IMPLIES ANY PROFIT OR GAIN. THE DATA HERE IS MERELY AN EXPRESSED OPINION. TRADE AT YOUR OWN RISK.

Wednesday, August 25, 2010

Market Trend Remains Down


Note: I'm on a bit of a summer relaxication until later next week so posts will be brief and to the point.

Today the market tanked lower in the morning on the heels of the horrible housing data. But then floated higher most of the day until the last 30 minutes. The bad housing data along with the large amount of pessimism in the financial media (see above CNBC screenshot) have me thinking a short term bottom might be either at hand, or close. So for the real aggressive short term traders, I'd have my ear close to the ground tomorrow and the rest of the week for minor bottom to form. But as you'll see from the wave count I have below, the market can easily keep falling and falling, so getting bullish is something I would definitely not do, and I would not remove all my short positions just in case the market just continues lower and lower. But for some of my short term trades, I often take profits when I get them. So the medium and long term players shouldn't even be concerned with these possible short term bottoms until key levels are broken, which right now is at 1100.14. Hopefully I'll be able to lower this key level soon, but right now we still need some waves to unfold to complete a larger 5 wave pattern from the highs before that's comfortably possible.


Above is the wave count which appears incomplete. The first part of the decline is clear. But the recent waves look like impulse moves, but can be labeled in several different waves. So I don't want to get too caught up in the little details of each smaller wave since we might be in a 3rd wave at various degrees and unrelenting selling for a long period of time may be upon us. As the wave structure unfolds and rallies get bigger I will be able to be more certain of the smaller waves in this pattern. But as long as the market keeps making lower lows and lower highs, the trend is firmly down and worrying about the little waves right now is not of a high priority right now. As soon as the structure becomes more definitive, I'll post my outlook on it.

So despite being on guard for a short term bottom possibly forming, I'm still overall firmly bearish for the medium/long term, and am looking for good opportunities (like rallies) to add to my shorts when they arise.


PLEASE NOTE: THIS IS JUST AN ANALYSIS BLOG AND IN NO WAY GUARANTEES OR IMPLIES ANY PROFIT OR GAIN. THE DATA HERE IS MERELY AN EXPRESSED OPINION. TRADE AT YOUR OWN RISK.

Monday, August 23, 2010

EWP Continues to See the Future


The market was an utter snoozefest with the exception of the first and last 30 minutes today. The market surged higher with strong internals and with much "glee" in the financial media with all the M&A (mergers and acquisitions) activity in the market. But the glee didn't last long and reality set in that this M&A activity does nothing to uplift the economy, and in fact probably will just lead to more consolidation and streamlining, which means more downsizing (my opinion).

Volume was extremely light today as it didn't even get above 900 million shares on the NYSE, so we should keep that in mind as we read the markets here.

What's of great significance though is how well the market is following EWP's impulsive rules and guidelines which allows us to gain a strong edge in the market in my view. Last night I stated that 1100.14 was the key level for the very short term bears to hold, and they had no problem doing so prior to this morning's reversal at 1081.58. The bears remain in comfortable control and lower levels should be acheived in the coming days, and possibly weeks or months by the way this market is unfolding right now.

Notice that the above wave count has us setting up nicely for a wave iii of (iii) of 3 of [3] or C. Which means total market destruction in the coming days. Anything short of that means that other possibilities are on the table. It doesn't mean they're all bullish, no way. It just means that wave ii, or wave (ii), is just becoming more complex than I thought. As long as 1100.14 remains intact, I have high confidence in remaining aggressively bearish here. And only a break of 1129.24 would break my bearish spirit.


CANDLESTICKS


Above is an hourly chart illustrating the recent reversal candlesticks we've seen at this timeframe recently. I circled the ones I wanted you to pay attention to. You can see that when we get those long wicks, especially when a strong candlestick follows, we get a strong move in the direction of the reversal for several more candles. So you can see how significant today's bearish reversal early this morning may be. This supplements the wave count well too since it suggests the market should fall hard in the coming days. For extremely aggressive bears, I'd use today's high of 1081.58 to really hammer this market short here. Also note that the daily candles show that the market rallied to a strong new high above Friday's high, and then closed significantly below Friday's open. These candlestick patterns suggests that at least in the short term we'll see further selling to new lows this week. But with the EWP wave count shaping up the way it is, and with 1100.14 well intact, the market can easily fall much much further.


EURO


Stocks and the euro are moving more or less together lately, and both are unfolding in nice EWP wave patterns. With the euro and stocks lining up well for 3rd waves at various degrees, I wouldn't want to get too cute with entry points. The profit potential for the bears if my above euro count is correct would be enormous. This also lends itself well to the bearish stock count as well.

PLEASE NOTE: THIS IS JUST AN ANALYSIS BLOG AND IN NO WAY GUARANTEES OR IMPLIES ANY PROFIT OR GAIN. THE DATA HERE IS MERELY AN EXPRESSED OPINION. TRADE AT YOUR OWN RISK.

Sunday, August 22, 2010

The Week Ahead


PRIMARY COUNT

In the short term, the market is unfolding in clear 5 wave declines. Volume is still light relative to normal non-summer days, but the trend still continues for volume spikes on selloffs and volume falling on rallies. This is bearish. Most down days lately have had NYSE trading around 1 billion shares at least, while rallies lately have been in the high 700 to low 800 million share range, which is extremely light, even for summer trading.

The above count is my primary count. Only a break above 1100.14 would cancel it out and put the bullish alternate below on equal ground with a new bearish count. The bearish count above suggests a small rally, perhaps early Monday morning, followed by a 3rd wave at various degrees that should send the market lower in a virtual straight line.

The evidence remains that the bears have control of the market and I would still be aggressively shorting rallies with stops just above 1100.14 for aggressively short positions, and above 1129.24 for less aggressive positions.


ALTERNATE COUNT

Above is the bullish alternate count. Short term, the market is unfolding in 5 waves, but in the bigger picture we still only have a 3 wave drop from the 1129 high. So until that morphs into a large 5 wave drop, we have to respect this bullish potential. This doesn't mean I'm bullish or will hold back from being aggressively short at this point. It just means that it's something to watch and be aware of as the market unfolds this week. The question this week will be whether the market is moving in a manner that coincides better with my top count above, or more in line with the alternate count below that. A break above 1100.14 would put this bullish alternate count higher up on the probability list.


PLEASE NOTE: THIS IS JUST AN ANALYSIS BLOG AND IN NO WAY GUARANTEES OR IMPLIES ANY PROFIT OR GAIN. THE DATA HERE IS MERELY AN EXPRESSED OPINION. TRADE AT YOUR OWN RISK.
StatCounter