Wednesday, April 7, 2010
No Internet Access
I will have little-to-no internet access the rest of the week so I might not be able to put up any posts, and if I do they will be very brief. Nothing has changed from yesterday. A top might be in that should take the S&P to at least 1171 but probably quite a bit further before it bottoms. If the market chugs higher it still has the thrust from the triangle structure that should eventually mean a sharp move back to at least that 1171 level before considering a bottom. So I'd be looking for a top and reversal anytime now. At the latest, I'll be back in full next week.
Tuesday, April 6, 2010
New S&P High Makes 5 Waves up from Triangle, Reversal Anytime Now

The above two charts are just updates from yesterday. The S&P made a new high today, making a 5 wave rally from the triangle possibly complete today. The fact that the Dow failed to make a new high as well adds to the evidence that perhaps a top is in right now. Even if the market surges higher again to have the Dow confirm the S&P's rise, it still leaves us with a 5 wave rally from a triangle which means a reversal is right around the corner anyway. The short term target is 1171 in the S&P cash index, but judging by the very weak 5 wave thrust rally, I think the decline will be much bigger and stronger than just dropping to 1171. If I see good evidence that a top is confirmed to be in and there's a good opportunity to enter then I'll get aggressively short with a stop at the highs on the year.
PLEASE NOTE: THIS IS JUST AN ANALYSIS BLOG AND IN NO WAY GUARANTEES OR IMPLIES ANY PROFIT OR GAIN. THE DATA HERE IS MERELY AN EXPRESSED OPINION. TRADE AT YOUR OWN RISK.
Monday, April 5, 2010
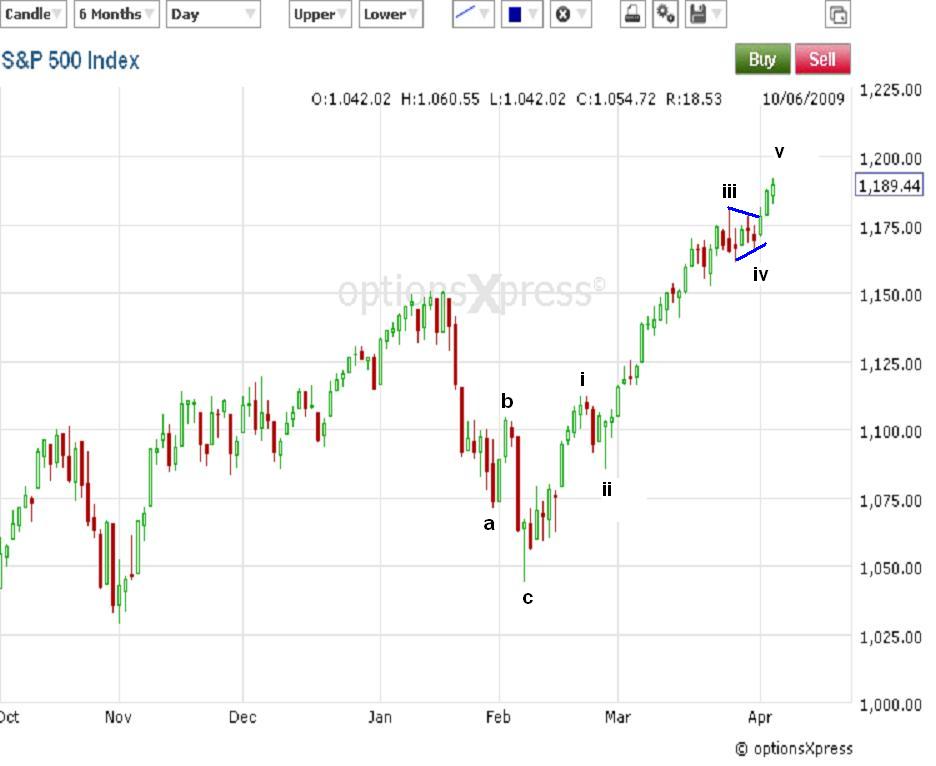
S&P Finishing up a Thrust from a Triangle that Started Last Week

The market appears to be in the final subdivisions of a thrust from a triangle that started last week. Looking at the daily, you can see that it's possible to count the rise a completed 5 wave advance already. But looking at the smaller timeframes, it appears we are still going to edge higher at least one more time.

Above is just a close up of the triangle structure. Normally, thrusts from triangles are very sharp and straight affairs, however this thrust is quite elongated as you can see from my intraday chart above. Notice that wave i. is very strong as it burst out of the triangle, but then it was sold aggressively for wave ii. Then wave iii. was another strong burst higher, only to be met with a brick wall that made the market move sideways the rest of the day. To make a perfect 5 up from the triangle, I'd like to see another sharp burst tomorrow. This would be a good opportunity to start getting short in my opinion. Thrusts very often reverse immediately to the apex of the triangle, and in this case that would be around 1171 level. So my strategy is to ease slowly into short positions on the S&P and then load up on signs of a reversal in order to ride the market down to at least the 1171 area. It may snowball into a bigger decline from there and that would be more than okay for me, we'll see.
PLEASE NOTE: THIS IS JUST AN ANALYSIS BLOG AND IN NO WAY GUARANTEES OR IMPLIES ANY PROFIT OR GAIN. THE DATA HERE IS MERELY AN EXPRESSED OPINION. TRADE AT YOUR OWN RISK.
Subscribe to:
Posts (Atom)