Saturday, October 17, 2009

VIX Warning of Extreme Complacency - Top Might be in Place


I almost missed this important event, but I heard Pete Najarian on CNBC's Fast Money mention the VIX and that it was down and I nearly fell of my chair. In the morning the VIX had rallied from the almost 4% drop to a new yearly low on Thursday and since the market continued with weakness into the close I made the mistake of assuming the VIX was up; WRONG. The VIX dropped another 1.3% Friday, despite the market falling fairly hard all day. This means that people were buying a lot more call options than put options on a fairly solid down day, and in doing so they pushed the VIX to the most complacent level it's been in all year.

This is big. This shows such a high level of complacency and optimism toward the market that it warns of a possible top in place RIGHT NOW. When you add the 5 wave decline in the futures and other data I mentioned in previous recent posts, it tells us that THE top might actually have just snuck up on us and be in place right now.

BE ON HIGH ALERT FOR A MAJOR TOP IN THE STOCK MARKET. THE VIX COMPLACENCY AND THE 5 WAVE DECLINES ARE HUGE WARNING SIGNS.

Friday, October 16, 2009

5 Down and a Nasdaq 100 Non-Confirmation in the Futures


The market battled back from its lows today but couldn't close the week above 10,000 in the Dow. If it did, it would probably be a bull trap and lead to sharp spike and reversal early next week. The S&P futures today make a nice 5 wave decline, then rallied in what looks like 5 waves up at the end of the day. However what should be the 5th wave that made a new high, was not confirmed by the Nasdaq 100 futures. You can see the comparison charts above. This divergence resulted in a sharp selloff into the close today, and also makes the Nasdaq 100 rally only in 3 waves, a correction. NYSE internals improved but were solidly negative. All in all, not quite the outstanding blowout week many bulls were hoping for in response to earnings.

So to end the week the Dow remains below 10,000 on a closing basis, internals and momentum waned significantly, we have 5 wave drops in the Nasdaq 100 and S&P futures, and a non-confirmed rally in the two indices followed by a sharp selloff.

Early next week should expose more what the market wants to do over the next few weeks. With all the evidence above in place, it sure opens the door for a market top. And if you look at my EUR/USD analysis showing the RSI topping levels and divergence, it only adds to the possible top being in place. This is just pure speculation at this point and we need further developments make a more solid assessment.

EUR/USD Position Worth Watching


A look at the daily EUR/USD chart shows a possible top starting to form. Notice on the daily chart above that the RSI is at a level that has previously market major tops (see blue arrows on chart) which is combined with an RSI divergence forming if today's decline holds. Now this behavior can remain for a while as prices work higher, but it's a sign of the end of a trend, not the beginning.

I'm watching the euro closely because as I've said before, when the EUR/USD tops so will the stock market.

GBP/USD Mixed Signals Now, I'm Standing Aside


After the GBP/USD thrusted from a small triangle and reversed right into the apex of the triangle for a textbook EWP move, I am now flat the pair.

The key now is to look at the GBP/USD bigger picture to know what it's going to do next. Is the 5 wave rally part of A wave? Is it a C wave of a flat correction? Is it the start of a larger 1-3-5 rally?

Attached is an 8hr GBP/USD chart. It shows that it's at levels that can end the entire rally and lead to the next leg down, i.e. the RSI has reached a level and reversed that has previously led to tops and reversals (see blue circles on RSI) and the pair is finding resistance right at the 61% fibo level (see blue circle on price candles). However, the entire rally was in 5 waves, which tells us that unless it's a C wave, then the trend is now up. I cannot count it as a C wave, so I have to assume it's part of a larger correction, probably an A wave, of an A-B-C rally. So I'm planning on a B wave to slowly and choppily grind lower before another power C wave occurs which should cap the entire rally move as long as it stays beneath 1.6744.

I rarely trade B waves as they're so difficult to trade, and there's conflicting signals is this pair, so I'm currently flat until structure unfolds some more.

Stock Weakness Today as Illustrated Yesterday


The stock market tumbled this morning which we had a pretty good signal would happen as shown from my previous posts; momentum was severely waning. Today is options expiration day so I don't want to read too much into the decline, so far. Internals are weak on the NYSE but it's still early. Plus, the euro and gold and silver are fairly steady in the face of the selloff so there's no real "deflation" or unwinding of high risk assets right now which might signal the start of something bigger occurring right now. It just looks like options expiration and profit taking occurring at the moment. But we'll see.

There are some things of interest though. Check out the daily S&P futures chart I posted above. If today's selloff holds, it will create a double bearish divergence on the RSI, as well as several other momentum indicators, in the recent rally. One RSI divergence on the daily chart is bearish enough, but to get two in a row is very problematic for the market and the bulls, especially after reaching and reversing at the "so important" Dow 10,000 level. We'll see if the divergence holds. The Russell 2000 and the Nasdaqs are somewhat weaker than the blue chip S&P and Dow so that shows a little bit of risk aversion on the table, plus the VIX is up 3% today after gettting to a yearly low yesterday, but option expiration definitely is effecting that. So an interesting day for a Friday which is typically uneventful.

As a bear, I'd like to see the market stay solidly negative and confirm the RSI divergence I just mentioned. So many bulls are waiting for a weekly close above 10,000 but I think if it occurs it will be a "bull trap". It will suck in all the bulls which will be a capitulation rally that forms a top and reverses.

So let's let the day play on see what develops. More later.

Thursday, October 15, 2009

Stock Market Getting Complacent, Overly-Optimistic per the VIX


I wanted to wait for all the late orders to come in so we can get an accurate breadth count on the NYSE and Nasdaq today. And now we have them. Advancers and decliners were practically up volume was barely higher than down volume. All-in-all, it was practically a divided and flat day, yet the Dow and S&P were solidly higher. Not much of a follow-through "at-a-boy" rally for the stock market after Intel posted great earnings spurring yesterday's big rally. The Nasdaq Composite on the other hand was solidly bearish internally today as you can see from the above chart on the top right. Quite a bit of profit taking in the tech sector that started the rally from Intel yesterday. The XLF, financials ETF, was down today after soaring over 3% yesterday, again offering no follow-through.

On top of all this waning momentum evidence we have the VIX, which made a new low on the year at 21.49. This should worry the bulls because it shows a high level of complacency and over-optimism in the market right now. There's no fear or skepticism in the market, and that's a recipe for a top.

There's no way of telling right now if the market has made a top, and in fact there's no real signs of it. But there is signs that top is forming at some degree as upside seems limited from here.

GBP/USD Consolidating in Triangle, Then Thrusts Higher


The GBP/USD looks like it's forming a triangle patter as seen in the 5min chart above. If so, 1.6211 should be broken before a new high. I showed you the longer term outlook for the GBP/USD a couple posts ago; it's bearish. However in the short term it's possible higher levels will be achieved. For short term players, the long side might be wise with a 1.6211 stop. Once the thrust to a new high occurs, protect profits by moving the stop loss to break even. Then trail the stop higher until stopped out. Don't get greedy, triangles are terminal moves and are quickly reversed once they've topped.

I closed my long position this morning at over a 200 pip profit. No need to hold onto that one after such a nice run. I'm looking for signs of a top so I can go aggressively short with a stop above 1.6744. But in the very short term, it seems that the pair has more upside.

Stock Rally Losing Momentum


Notice on the 15min Nasdaq 100 chart that the sharpness of the rallies since the bottom has waned. Each rally has gone more and more sideways to where my red lines look like dominoes getting ready to fall over. And if you look at my previous post giving a wave count for the NDX, it shows the wave count as a completed 5 waves up right now. The market may gring higher, but clearly momentum is waning. Also notice that the internals are weakening as well as shown by my circled NYSE and Nasdaq indicators. Breadth and volume is negative, and after such great earnings and the big rally yesterday, it's showing that the optimism has faded quickly. This current rally is exhausting and should result in a pullback. I'm not sure what magnitude it will be, but since all the major indices, except the Russell 2000, have made new highs and appears to completed a 5 wave rise from the recent lows, it opens the door to the possibility for a wave 2 or B top.

We'll see. But right now it looks like momentum is severely waning and a pullback or at least a pause in the uptrend is occurring right now.

Wednesday, October 14, 2009

GBP/USD Long Term Bearish, Short Term Bullish


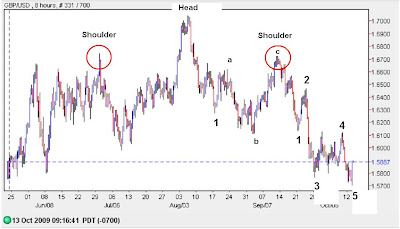
With my stop hitting on the GBP/USD short it's time to look at the bigger picture. This is one of the more clear and promising structures in many markets right now. There is a classic head and shoulders pattern seen on the 4hr chart above as you can see, as well as a clear 5 wave decline it just completed. Now here's the real test. In order for the decline to remain impulsive, with the trend, it must stay below 1.6744 which is the start of the 5 wave decline and the right shoulder of the head and shoulder pattern. Breaking above 1.6744 would turn the decline into a 3 wave drop and make it a correction, and therefore this pair would rally strongly to new highs on the year. So we can assume that this count is correct and that 1.6744 will hold. We can play the bullish side against 1.5700 if we're aggressive, or we can just wait for signs of a top and short it later on with a stop above 1.6744.

Long term, this pair is bearish, short term though it looks to have higher levels to obtain. 1.6100-1.6200 should be fierce resistance as it's the prior 4th wave area, two fibo retracement levels, and a severe congestion area.

Elliott Wave International Article on Earnings; October 14, 2009

Elliott Wave International (EWI) has a good article on stock market behavior related to earnings reports. I recommend everyone trading the stock market in the next few weeks to read this article. Check it out on the right side of this blog
They also have other free articles posted daily you can check out on the list located on the right side of this blog, titled "Earnings: Is That REALLY What's Driving The DJIA Higher?" in the Elliott Wave International box.

EUR/USD Bearish Reversal Candle Confirmed on Hourly Charts; October 14, 2009


With the turn of the hour the EUR/USD chart made a nice bearish reversal candlestick giving the bears a great short opportunity for the short term with a stop just above 1.4943. Profit levels will be determined later as we see if the bearish reversal candle carries over to the larger time frames, especially the 4hr and daily charts.

GBP/USD Rally Ending, Capped at 1.6024; October 14, 2009


The british pound has rallied strongly against the US dollar since the 5 wave drop preceding it (see 1hr chart above). This should be the end of wave ii within a much larger decline in the GBP/USD. The EUR/USD is forming a reversal candlestick on the hourly chart and will signal more bearish potential if a reversal candlestick occurs on the daily chart.

For the short term, the 1.6024 level is where the five wave decline started, so this level will most likely not be exceeded in the short term. As with EWP most of the time, the bearish setup brings about a great risk:rewad opportunity where it's possible to short the GBP/USD (currently at 1.5969) with a stop just above 1.6024 and a profit target of at least 1.5700. So it's a risk of about 55 pips to possibly make 269 pips!

EUR/USD Possible Bearish Setup; October 14, 2009


The EUR/USD has formed a wedge, possibly an ending diagonal. According to EWP, ending diagonals are ending moves that signal a severe ending of the previous trend. This is exemplified by the typical throwover above the trendline (see above EUR/USD 1 hour chart) and then reversal which is creating a reversal candlestick on the hourly chart. If the reversal candlestick holds and a new high on the day is not achieved, it could signal a significant reversal for the EUR/USD and bring an advantage to the bears.

Right now, only the GBP/USD is offering a clear EW pattern, and it's very bearish right now and in a small wave ii rally.

Thrusting From a Triangle; October 14, 2009


Intel's earnings along with better than expected retail sales data, still negative though, thrusted the market from a triangle as you can see from the above Nasdaq 100 cash chart. There's a huge gap from this morning's open left by the over-aggressive bulls and that should be filled soon or it will hint that a top is near. As I said earlier, I fully expect earnings the next few weeks to absolutely blow estimates out of the water and be very very very good. This will probably send the market higher for weeks.

This does not change the long term bearish picture.

Tuesday, October 13, 2009

Intel Reaction Warrants Bullish Wave Count; October 13, 2009


With the reaction to Intel's earnings really really good, we need to expect a large surge in the stock market tomorrow morning. It fits well into the Nasdaq 100 cash wave count as you can see on the above 15min chart. The rally tomorrow may complete the entire rally of the big wave B or 2, or it's just a wave 1 and will continue with waves 3 and 5 to higher levels. If it's the last 5 wave rally of wave 2 or B then it should take the S&P to the 1100-1120 target easily before finding resistance. If it's just a wave one of a larger 5 wave move, then it will open the door to the 1200 S&P level. With all said and done, the market continues to be very bullish in the short term.

Intel "Blasts" Earnings and Forecasts as Expected; October 13, 2009

Well I said this morning that I can't imagine companies not configuring their books to present a rosie picture of their financial statements and post what appears to be great earnings and forecasts and Intel proved that after the bell today. That wasn't important as I knew that would happen most likely, and Intel is a key bellwether for Tech and even the overall economy. What was important was the reaction to the announcement. So far it's extremely positive and bullish as Intel shares soared 5% on the news, and that's after a huge run up into earnings. We'll see if it holds.

The next step is the stability of the financials. We'll see the market's reaction to their earnings in the coming days.

Here's the CNBC Intel article: http://www.cnbc.com/id/33293029#

Watch Intel After the Closing Bell; October 13, 2009

As elliotticians we don't believe news or earnings drive the stock market, we believe that sentiment and the wave count drive earnings and news. Since we're at a crossroads here it might be worth watching the market's reaction to Intel's earnings report after the closing bell today. Intel doesn't drive the market, the wave count does, but it's worth watching the market reaction to Intel because we seem to be at a crossroads of either having a top already in with the mild divergences mentioned earlier, or we're soaring to new highs into the 1100-1120 area. Intel's reaction may give us a clue which one is correct.

Here's the CNBC FastMoney story: http://www.cnbc.com/id/33293260#

Europe Not Too Confident in Earnings; October 13, 2009


Europe ended very weak across the board (see above) which does not suggest confidence and strength going into earnings. It could just be profit taking from the huge rally leading up to earnings; I mean afterall, with the huge run ups so far how much higher can they really go.

But with J&J's disappointment, the Goldman Sachs downgrade, and now Europe taking profits, perhaps it's a sign of what's to come in the next few weeks.

British Pound Bearish; October 13, 2009


Not pretty, but possible. The GBP/USD formed a major head and shoulders pattern and is decline in 5 waves, albeit an ugly 5 waves, but 5 waves nonetheless. This is despite the EUR/USD rallying to a new high. This divergence is bullish for the US dollar.

EUR/USD Makes New High, Minimum Bullish Potential Satsified; October 13, 2009


Last week I said that the EUR/USD appears to be charging toward a new high above 1.4843. The main reason was that the decline previously did not look impulsive as it was choppy and slow followed by a very strong impulsive looking rally. Again, EWP shows its superiority in analysis as it basically predicted a new high was coming in the EUR/USD.

But now that a new high as been acheived, it opens the door now to a major top and reversal any day now. Even though eyes are on earnings, the US dollar (opposite the EUR/USD) is still a main driver of higher stock market prices. The EUR/USD tops, so does the stock market. First area to look for a top is the 1.50-1.51 area.

Waiting for Earnings Deluge, Market Divergence Still in Place; October 13, 2009

The market divergence between the Nasdaq and S&P futures remains in place so it possibly sets up a nice bearish move if earnings are similar to Johnson and Johnson's this morning, plus Meredith Whitney (sound and logical financials bear) downgraded Goldman Sachs since it hit her bullish price target. That's interesting because everyone is now looking toward financials to lead the market higher, and Goldman Sachs is the premier financial institution that tends to lead the financials. So if Whitney downgrades them right before they're posting their earnings, it could be interesting if by some incredible longshot Goldman Sachs posts not so good earnings. This would be amazing though as they tend to break records whenever they announce, but what's more important, especially as an elliottician, is the reaction to the announcement. Earnings may be bullish but the reaction is to sell heavy.

As long as the mild market divergences are in place, it's possible for a top to be in and a selloff to ensue. Bullish underpinnings still cling to this market though and the path of least resistance still points up.

We'll see.

I remain short with long dated options and have small bullish position with a call spread on the XLF with a November 2009 expiration.

Monday, October 12, 2009

Minor Bearish Market Divergence in Place, But Strong Bullish Momentum in Place; October 12, 2009


Overnight the S&P futures barely broke to a new high while the Nasdaq futures did not. Also worth noting, the S&P cash index fell less than a point shy of a new high above 1080 while the Dow cash index made a clean new high. The high risk small cap Russell 2000 index was weaker with the Nasdaqs today suggesting that high risk holdings are being abandoned. This type of behavior occurs at market tops, and seeing as that we're looking for a major market top, it's worth noting this and watching it.

On the flipside though, the market is still very bullish as I can see it. It's rallying in what looks like subdivisions of an impulse rally, suggesting the larger trend is still up, internals are still strong suggestions that buying demand remains solid, this week is options expiration week (actually on Friday) which usually has resulted in a bullish tailwind for the week, and corporate earnings for the 3rd quarter are coming out in the next 3 weeks.

Let's focus on earnings some more. It seems pretty obvious to me that the earnings will come out and just blow the cover off the ball, and will also give great blooming estimates for the future. However this will be on the backs of massive layoffs and downsizing measures which will severely hinder this consumer based economy in the long run. That will be ignored most likely, and the great window-dressing earnings data we're about to see will be reason to surge this market higher.

So despite a very minor bearish market divergence, I see the market on firm footing to push higher in the coming weeks as earnings results come in. It's possible that people will "sell the news", but the bottom line is that earnings will be "outstanding" for the over-exuberant market bulls that do cartwheels on CNBC every day about how we're in a new bull market.

The target for the S&P is the 1100-1120 area. Once we reach that range I'll be on alert for a top again.

StatCounter