This Elliott Wave blog is dedicated to sharing Fibonacci ratios and other technical analysis for forex signals, index futures signals, options signals, and stock signals. Elliott Wave Principle puts forth that people move in predictive patterns, called waves. Identify the wave counts, and you can predict the market.
Friday, June 1, 2012
Stocks Tank, in Line with Forecast; Euro Daily Candle Warning to Bears
The weakness in stocks continued to a new low as forecast in last post. There are several different ways to count the decline, most of them are impulsive suggesting the larger trend is firmly down for the foreseeable future. The only question is at what degree should the waves be labeled? Above are my top choices. Both have one thing in common, if the counts are correct prices will stay below the wave (ii) high at 1415.32 (S&P cash index). So I'd have stops just above that level for now and let the market play itself out. As the pattern develops more, hopefully I can drop my stop lower to reduce risk.
Learn Elliott Wave Principle (EWP)
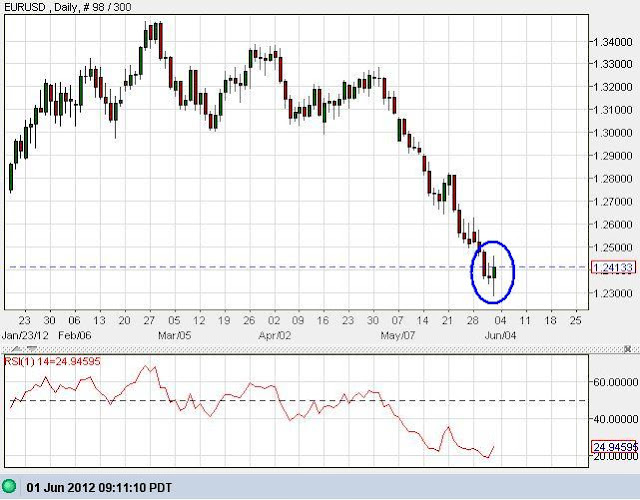
The action on the daily EUR/USD chart is very telling, and is worrisome for the bears. It shows an RSI that is trying to recover from being deeply oversold accompanied by a daily outside reversal candlestick forming on the daily chart. If that candle holds up through the close today, the EUR/USD looks to have put in a bottom today. When you add the fact that the euro has historically made a lot of major reversals on news days like this, it is telling the bears to take be careful. I've removed half of my short position already and am considering removing more before the close today. Euro bears beware here.
How a Simple Line Can Improve Your Trading Success
Just to add on to my previous thought, the 4 hour chart above shows a long and drawn out bullish divergence occurring between the euro's price, and the RSI. Priced continued to make lower lows while the RSI was making higher lows. This build up has carried over to the daily chart where the RSI is bouncing hard out of oversold territory, and is doing it on a big news event today and an outside bullish reversal candlestick forming. Euro bears beware.
PLEASE NOTE: THIS IS JUST AN ANALYSIS BLOG AND IN NO WAY GUARANTEES OR IMPLIES ANY PROFIT OR GAIN. THE DATA HERE IS MERELY AN EXPRESSED OPINION. TRADE AT YOUR OWN RISK.
Wednesday, May 30, 2012
Stocks Falling in 3rd Wave; Euro Heads Towards 1.1875
The projected wave iv I had in last post has gotten too big compared to wave ii at the same degree. Although it breaks no EWP rules, it is not ideal and does not have EWP's "right look". So I relabeled the waves to what you see above. This count is aggressively bearish, and I usually like to go with the more conservative and cautious count, but price action demands this count be respected. And the euro is showing no signs of slowing down on its way to 1.1876, which is also a good setup for stocks to selloff hard with it. Look out below!
On a side note, don't miss out, only one more day to get Elliott Wave International's free Financial Forecast newsletter. Offer expires Thursday, May 31st. Take advantage of free tools everyone: Download EWI's new 10-page May 2012 Elliott Wave Financial Forecast here .
The euro has solidly broken through 1.2600 support. As I said in last post, there is nothing really holding up the EUR/USD until 1.1876. Since last post, the EUR/USD has dropped almost 200 more pips. Although price action looks extremely bearish, and a waterfall of a decline may occur, be prepared for pops along the way - at least psychologically. I don't see any reason to abandon the aggressively bearish view at this point. Longer term, the EUR/USD should make it to the 1.1876, and it's quite possible it will make it there in quite a hurry as the price action suggests.
14 Elliott Wave Trading Insights You Can Use Now
Also, remember this chart above from my May 12th's post (click here for full post)? It shows the weekly EUR/USD and the big declines that occurred after big chart gaps. In the past, there was a 2700 and 1100 pip loss following their gaps. The most recent gap occurred around 1.3000, and the pair is currently trading at 1.2400, which registers a 600 pip loss so far. So history is repeating itself. There still may be plenty more to go, but again, be prepared for sharp rallies and major reversal patterns. *** Momentum on the intraday charts is showing that a bullish divergence is building, and the daily RSI is oversold. I'm still aggressive in taking big short positions, but am also closely watching for any big reversal patterns that demand I protect my gains. ***
PLEASE NOTE: THIS IS JUST AN ANALYSIS BLOG AND IN NO WAY GUARANTEES OR IMPLIES ANY PROFIT OR GAIN. THE DATA HERE IS MERELY AN EXPRESSED OPINION. TRADE AT YOUR OWN RISK.
Subscribe to:
Comments (Atom)


