
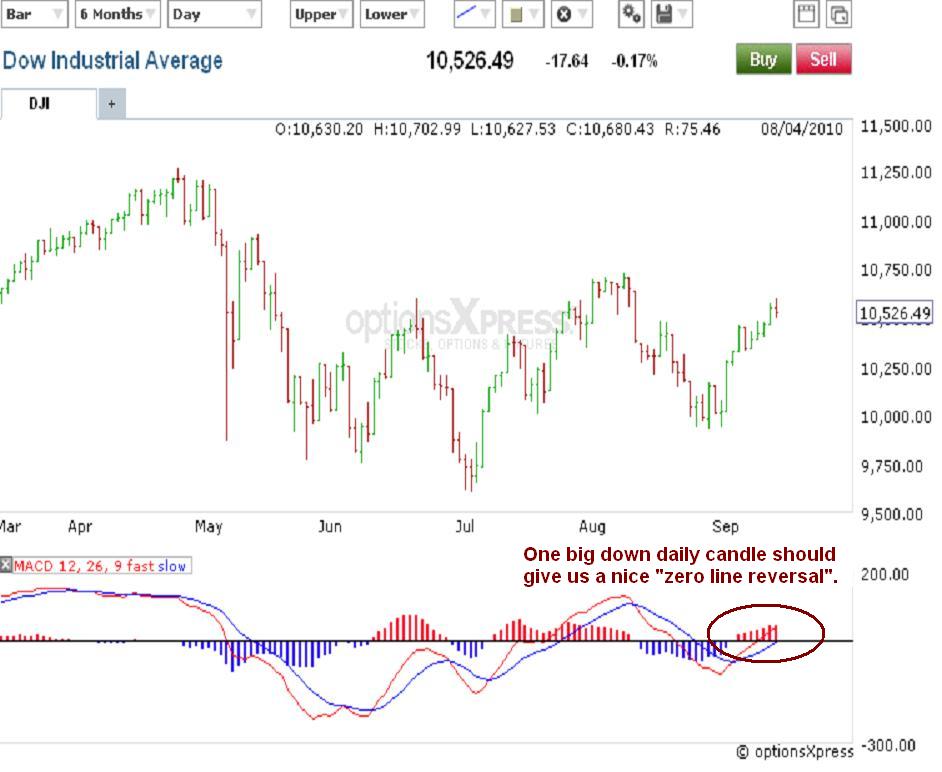
The Dow continued to follow the EWP forecast with a strong thrust from the triangle (see EWI Tutorial, sections 4.3 & 4.4 here). The overnight session saw the futures really soar higher, I'm sure raising some concern for the bears. But although thrusts from triangles are very strong and sharp moves which we saw in overnight trading, they are also completely reversed to at least the apex of the triangle rather quickly which is what we saw early this morning in the US session. The structure in the Dow is no different. The only problem here for the bears is that since reaching the near the apex of its triangle it has failed to continue lower. A break below wave a of the triangle at 10,481 would be a really good sign that the top is in.
The setup here is nice if today's highs can remain intact. The triangle and resultant thrust higher and reversal lends itself to a top being in right now. As long as today's highs remain intact we can say with confidence that a top is in place that could be quite significant when we get to next week. If today's highs are broken, it means wave v of C of (ii) is subdividing higher. But that still shouldn't last long or go much higher from current levels anyway.
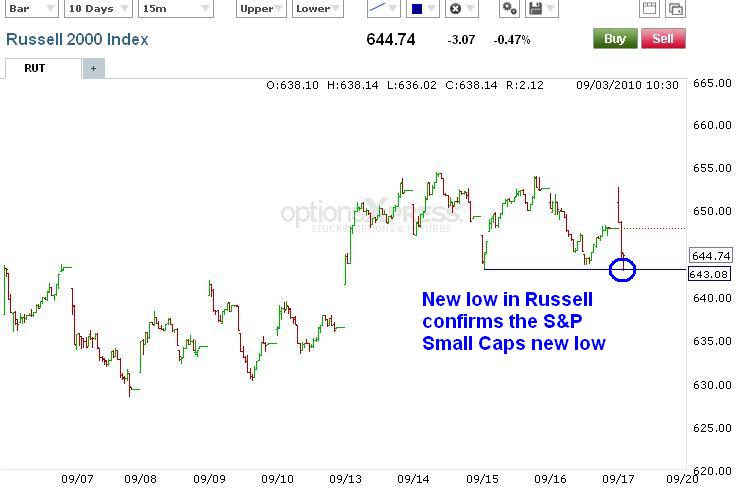
Yesterday I mentioned that the S&P Small Cap index made a slight new low but that it was unconfirmed by the Russell 2000 small cap index. I suggested that it can be viewed as bullish in some cases since there was a non-confirmation in place. But I argued that within the current context of the market at this time, I felt the S&P Small Cap was actually leading the market lower, and the break to a new low all by itself was actually a bearish sign. Well today the Russell 2000 also made a slight new low, confirming the S&P Small Cap index's new low yesterday. So as long as their highs on the week remain intact, this could be a fairly bearish development the market is signaling to us very quietly.

And to follow up on the stochastics "wedge" I mentioned yesterday, you can see here that the wedging continued on the hourly Dow chart but has recently turned down to attempt to break out of the wedge formation. The S&P stochastics (not shown here), are even more bearish as they've been trending down with lower highs for the past several hours.
Don't forget to check out EWI's free Ultimate Technical Analysis Handbook they're still offering right now for more basic technical analysis methods to help supplement your trading.
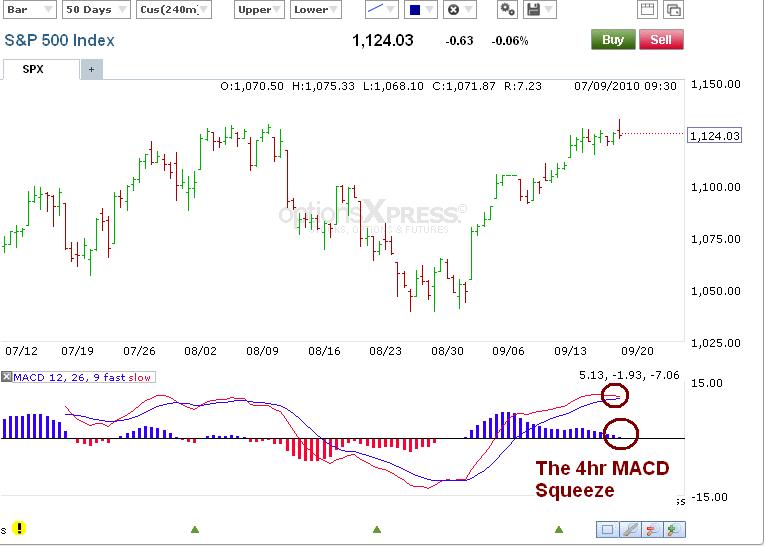
And lastly, on the S&P 4hr chart you can see the MACD "squeeze" is on. The moving averages are about to cross down and it's causing the histogram (in blue bars) in the middle of the indicator to get squeezed. This suggests that the larger timeframes are now trying to turn down as well. And even though prices remain elevated and we've had several higher closes this week, momentum indicators are continuing to drag down.
I'm a bit disappointed in today's action in that I thought it would be a bit more eventful. I'm not sure we'll get any big swooshing move to the downside today, but if today's highs can hold into the weekend, it would still be a very good sign going into early next week for the bears. So if nothing today, we just have to wait...
COMMODITY TRADER FREE RESOURCES:
FREE SERVICES NOTE: EWI is offering some of their commodity services for free until noon Thursday, Sept 23 (Eastern time). Learn more and get instant access to EWI's FreeWeek of commodity forecasts and trading education now -- before the opportunity ends.
Article: Will Grains Gain OR Wane? Find Out For FREE
PLEASE NOTE: THIS IS JUST AN ANALYSIS BLOG AND IN NO WAY GUARANTEES OR IMPLIES ANY PROFIT OR GAIN. THE DATA HERE IS MERELY AN EXPRESSED OPINION. TRADE AT YOUR OWN RISK.


