
Again the Nasdaqs, financials and small caps led the market higher. Not an encouraging sign for the bears. It just feels like the market is going to continue higher indefinately and it's tempting to get in on the long side because it's just too much to tolerate, right? If that's the case, then perhaps we can view it as a contrarian indicator and signaling a top is in fact forming. If we feel the market is going higher indefinitely, then we're probably not alone. Watching and reading financial media today I still get the short term folks talking about "taking profits" in this market, but the longer term folks were now predicting "Markets to Explode Higher Like a Rocket Ship" like one analyst said on CNBC today. That's what I want to hear more and more of here as we top out.
The above screenshot is of today's market internals. You can see that the rally today was strong, but again volume remains light as it didn't even breaking the 1 billion share mark. Volume should re-enter the market Thursday and especially Friday since it's options expiration day. Also, Friday the 17 and Monday the 20th are the two key dates I'm watching for a major reversal since it September 19, 2008 was when a major market top occurred that led to the meat of the massive credit crisis' decline. But right now, with volume this light on rallies lately, I couldn't get too excited if I was a medium-to-long term bull here.

Above is an hourly chart of the Dow showing the potential wave count. The ending diagonal structure I suggested last week was technically voided with the sharp deep rise today. But the structure itself has left it's footprint of weakness on the charts anyway. Notice that the RSI is still failing to make new highs with price. A behavior similar to what occurred for that long drawn out wave C of the ending diagonal in July. And that resulted in a major decline, something I believe will repeat itself here soon with the current structure.
Overall the EWP structure is not nearly as clear as an elliott waver would like it to be. But so what, it's rare that the market will give us such a gift anyway. We have other tools at our disposal to help us with the short term structure as we wait for the waves to reveal themselves. In my view, there are various ways to count the action from this year's top, and right now it's looking like it's all just part of a big correction. But even if this is the case, I don't think the correction downward is over, so we should at least see some significant pullback in the short term. Most likely sometime at the end of this week or early next week.
With that in mind, I think a break above 10,719.94 in the Dow AND 1129.24 in the S&P would really put a damper on the longer term bearish wave count. But that still doesn't prevent a short term sharp selloff from occurring. So I'm playing the short term at this point. The easy money to the upside has probably already been made, the risk is to the downside here.
With that in mind, I think a break above 10,719.94 in the Dow AND 1129.24 in the S&P would really put a damper on the longer term bearish wave count. But that still doesn't prevent a short term sharp selloff from occurring. So I'm playing the short term at this point. The easy money to the upside has probably already been made, the risk is to the downside here.
FAKEOUT COMING AT THE UPPER END OF THE RANGE?

Above is a daily chart of the Dow showing the range it's trading in which I'm sure the overwhelming majority of you are well aware of. I put this up here because I think the market is going to try and fake out the masses somewhere near the top end of the range here. This range has been mentioned over and over and over again in financial media so it's getting quite old and obvious at this point. So I can't imagine the 1130 S&P level offering much of a reversal point for any significant pullback. It is the level of the last high though, so a minor pullback may occur there, but a sustained decline I doubt. It's just too obvious.
Rather I expect the market to either decline near current levels, quite shy of that upper channel line, or it will top and reverse after a strong break above that trendline. Either move would fool most people in my view: if it tops and reverses prior to the top end of the channel a lot of folks will miss the move and might remain bullish and continue buying dips or just rush to sell everything since they believe they missed the top. Both behaviors I feel would be important to sustain a nice long healthy decline; and if the market rallies above that upper trendline, it may suck in the remaining bulls into the market to finally get sentiment at such a bullish extreme to where the market tops out and reverses anwyay.
So watch the action carefully just below and just above that upper channel around 1130 S&P and around 10,700 Dow.
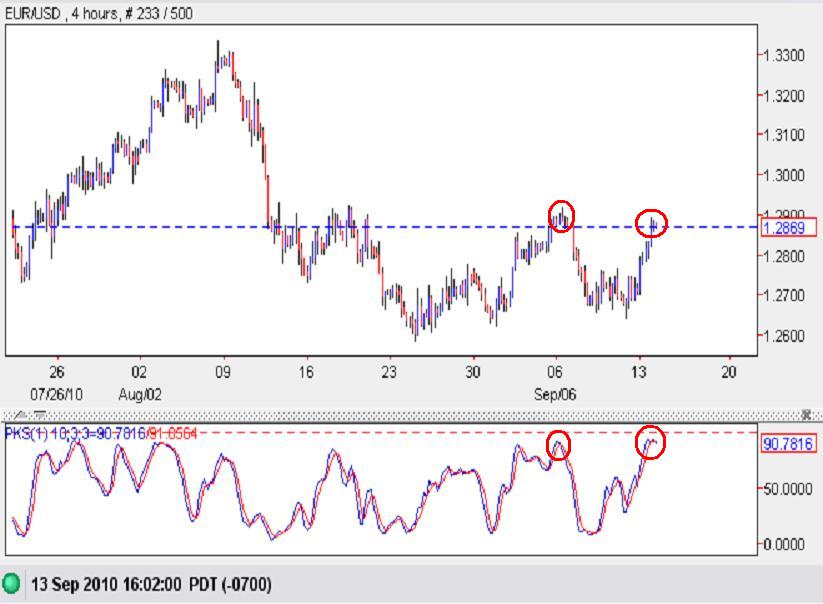
Above is a 4 hour chart of the euro. The wave count of the short term movement is a bit questionable at this time so I didn't post one. But it does look like it declined impulsively and the bulls haven't made any significant progress with new highs or anything, so I'm still bearish. It sure seems like the euro wants to trade higher, but anyone trading currencies for a while knows that they sure do like to stop and reverse sharply on a dime whenever they feel like it. Perhaps we're approaching that time.
Above you can see the stochastics are at levels they were at the last time the market declined sharply, and they're crossing and rolling down right now. EWI's Ultimate Technical Analysis Handbook discusses other technical indicators, similar to the stochastics mentioned above and in last week's posts, in depth if anyone's still interested. Although the stochastics is not really a good timing indicator for reversals, and the euro can easily continue higher from current levels and create an overbought extreme and bearish divergence during those new highs. But with the recent high of 1.2918 just around the corner, I like having a stop just above 1.2918 as a good risk/reward short trade. A break above 1.2918 will call for a new outlook for the short term possibly, but the longer term is still firmly bearish in my view.
Above you can see the stochastics are at levels they were at the last time the market declined sharply, and they're crossing and rolling down right now. EWI's Ultimate Technical Analysis Handbook discusses other technical indicators, similar to the stochastics mentioned above and in last week's posts, in depth if anyone's still interested. Although the stochastics is not really a good timing indicator for reversals, and the euro can easily continue higher from current levels and create an overbought extreme and bearish divergence during those new highs. But with the recent high of 1.2918 just around the corner, I like having a stop just above 1.2918 as a good risk/reward short trade. A break above 1.2918 will call for a new outlook for the short term possibly, but the longer term is still firmly bearish in my view.
At this juncture, despite the larger picture perhaps being a little unclear as to the wave count and future movement of the market, the upside potential for equities seems very risky and limited. I refer to EWI's recent article, 3 Reasons Now is Not the Time to Speculate in Stocks, for a little big picture perspective to help keep things in the proper context. But for short term traders, I see some big moves coming soon, and the evidence suggests it's to the downside.
PLEASE NOTE: THIS IS JUST AN ANALYSIS BLOG AND IN NO WAY GUARANTEES OR IMPLIES ANY PROFIT OR GAIN. THE DATA HERE IS MERELY AN EXPRESSED OPINION. TRADE AT YOUR OWN RISK.
No comments:
Post a Comment