Thursday, November 11, 2010

Big Picture: Euro, Stocks

PLEASE NOTE: EWI's Forex FreeWeek is now live and ends next Thursday, November 18 at noon EST. They're giving away full access to their intraday and end-of-day Forex forecasts.


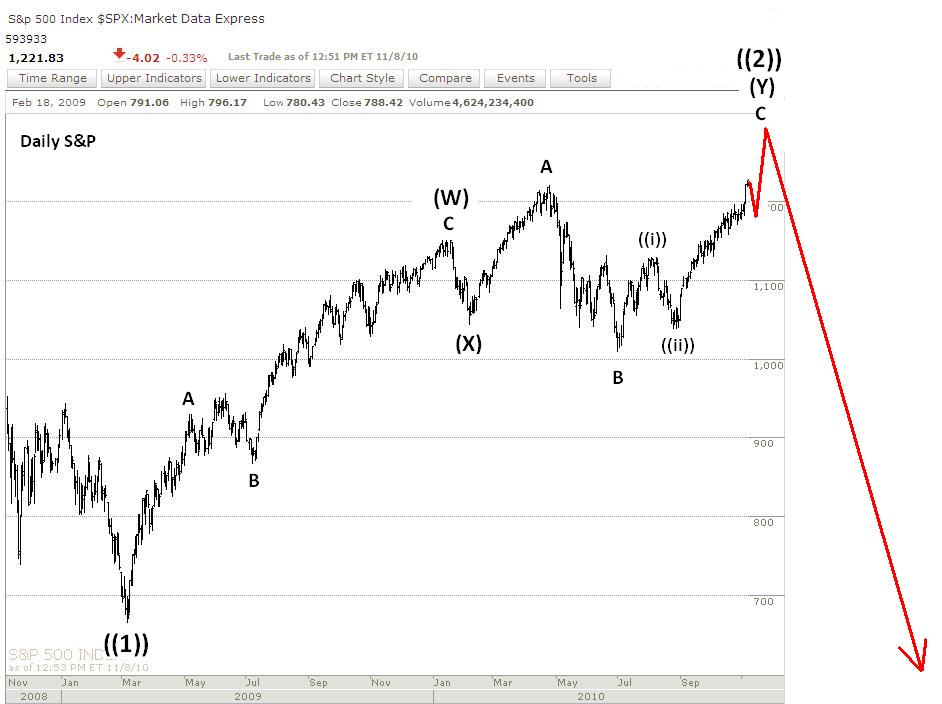
Looking at the bigger picture wave count in stocks we might be in for a flat few months ahead as a Minute wave ((iv)) takes hold.  There was a pretty big and sharp move for Minute wave ((ii)) and elliott wave principle's guideline for alternation suggests we'll see a more flat correction for wave ((iv)).  This means we'll most likely have a triangle or "flat" correction take us into 2011.  My best guess at this point is a sideways move in stocks into the first or second week of January 2011 where buying interest is usually strong which might give us Minute wave ((v)) and finish off Primary wave ((2)) once and for all.  I would love to see a triangle form at this point because it would be a clear sign of a topping formation occurring, and the ensuing sharp thrust and reversal will in fact finish off the previous trend.

It's still important to note that the XLF's lagging behavior, silver's apparent blow-off top, and the US dollar perhaps having put in a major bottom, we must be vigilant in watching for stocks to top Primary wave ((2)) at any time.  I'll be focusing a lot on the euro and the XLF in the coming weeks because I feel those two markets can give us the best clues as to whether or not Primary wave ((2))'s top is near or not.  Also note that tech giant Cisco is down almost 16% at the time of writing, and they are often a leading indicator of where the overall market is heading for the next quarter.  I'm not saying the market will drop 16% as well, but the overwhelming weakness is Cisco seen today may be a sign of weakness ahead for the stock market.  Also note that today is the Veteran's Day holiday so perhaps not all market participants are fully engaged in trading and may not return until Friday or Monday.  So the selling we see in the overall market right now may not even be near complete.


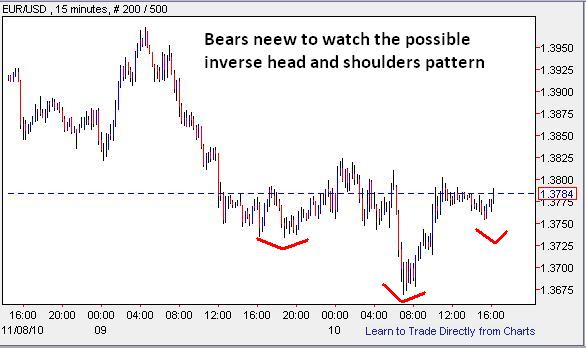
Speaking of the euro, I'm posting the daily chart here of the euro vs the US dollar.  It shows a clear 5 wave decline I'm labeling an Intermediate wave (1), followed by a Minor ABC correction for Intermediate wave (2).  The triangle, thrust and reversal for Minute wave ((iv)) and ((v)) was our first clue of a major top being at hand.  If the above count is correct, the euro should be well on its way to parity with the US dollar, and probably much further.  A euro decline of this magnitude would mean a major rally in the US dollar would put significant pressure on commodities and stocks in the process.  So even if you don't trade currencies, it's worth at least tracking the euro and the dollar for clues to the future movement of commodities and stocks.

PLEASE NOTE: THIS IS JUST AN ANALYSIS BLOG AND IN NO WAY GUARANTEES OR IMPLIES ANY PROFIT OR GAIN. THE DATA HERE IS MERELY AN EXPRESSED OPINION. TRADE AT YOUR OWN RISK.

Wednesday, November 10, 2010

Cisco Making Futures Grumpy; Euro Bears Need to Watch for Inverse H&S


Internals today were quite bullish, and other than the Dow, the S&P, Tech, small caps and financials did quite well which explains the positive internals we see at today's close.  It seems highly possible that the stock market has formed a short term top though since silver appears to have finished a blow off top and the euro appears to have top as well.  How big of a top in stocks will only be determined as the wave structure unfolds in the coming days/weeks.  But looking Cisco down 12.5% in afterhours at the time of writing, and the S&P futures getting hammered right now as well, it's possible we'll see some more downward pressure tomorrow.


Nothing really compelling to note in the stock market as far as the wave count goes.  It seems that a Minute wave (iv) is probably unfolding which will eventually give wave to a Minute wave (v) rally that should finally cap off Primary wave ((2)) (see long term count).  Right now the Nasdaq Composite appears to be bumping up against resistance and prior congestion so a reversal from current levels would make sense.  And considering Cisco's 12.5% after hours drop it makes the reversal in Tech seem imminent.


The euro failed to pick up speed and continue its descent lower.  But the impulsive count still remains valid so I strongly favor the downside here since the profit potential is so great here.  I'd like to see the euro keep a 4hr (or higher) close beneath 1.3824 to keep my bearish stance comfortable.  A quick poke above 1.3824 and reversal doesn't count.  But a strong sharp shot and close above 1.3973 would get my attention and have me look at other markets and indicators to try and determine if the bears are still in control.

Elliott Wave Video Crash Course


On the 15min chart it gives some reasons for concern for the bears.  I don't like the sharp dip to a new low then reversal higher to trade sideways at prior congestion.  This is classic bottoming behavior, and know as an inverse head and shoulders pattern here.  This is another reason I'd like to see the euro remain well below 1.3824, because a close above that level on the 4hr chart or above may signal a sharp shot higher.  The best thing for the bears would be to see a sharp shot lower, preferably below today's low, during tonight's Asian or European sessions.  So tonight's action may be telling for the euro in the days to come.

Tomorrow is the Veteran's Day holiday.  It's on a wierd day, Thursday, but I still think a lot of folks will be taking time off and relaxing, perhaps the rest of the week like I am.  So we may not see much action or volume in the markets the rest of the week. 


PLEASE NOTE: THIS IS JUST AN ANALYSIS BLOG AND IN NO WAY GUARANTEES OR IMPLIES ANY PROFIT OR GAIN. THE DATA HERE IS MERELY AN EXPRESSED OPINION. TRADE AT YOUR OWN RISK.

Tuesday, November 9, 2010

Euro Should Continue its Decline; Stocks May be Rolling Over


Interesting market day today as it basically declined all day and formed a “rolling-over” look on the 10 day charts.  Looking at the internals we see quite a bearish picture with about 80% of stocks trading down on the NYSE at today’s close.  Volume was decent but nothing alarming.  So it seems that the uptrend may be showing signs of exhaustion and some bears may be coming in to take profits.  Looking at my daily count from yesterday we are set for a Minute wave (iv) decline, so perhaps we’re seeing the early signs of that today.  And looking at the very bearish euro count below, and the fact that it looks like the XLF (financial ETF) has finished a thrust from a triangle, it strengthens the outlook of a stock decline coming in the next few weeks.

NEW! Get 32 pages of FREE practical trading lessons in EWI's new Trader's Classroom eBook.

The above 15min S&P chart shows the rolling over action I mentioned earlier.  If Minute wave (iv) has started, I’d expect a slow, choppy and sloppy grind lower to sideways over the coming weeks.  This fits nicely with the holidays coming up which tend to bring a general malaise to the markets anyway.  Perhaps early January we’ll get the final Minute wave (v) with the beginning of the year buying in order to finish off Primary wave 2 once and for all.  But that’s pure speculation at this point.  What seems more likely is the short term picture suggesting a decline or sideways grind for at least a few weeks.

The euro continues to look extremely bearish and the US dollar looks bullish.  The euro thrusted from a triangle after the QE2 announcement but has now retraced that thrust and is testing a new low beneath 1.3696, which is all typical behavior of a finishing move.  In this case we’re looking for a finishing move that will mark a major top in the euro, and a major bottom in the dollar.  The decline so far has been very impulsive-looking so I’m expecting lower levels for the foreseeable future with the highs of last week remaining intact.

Elliott Wave Video Crash Course

It’s key to not that if the euro has topped and reversed, and the dollar bottomed and reversed, and financials continuing to lag badly, it will put pressure on stocks over the long term.  The XLF appears to have thrusted from a triangle which is now reversing itself and is now outperforming the overall market to the downside again.  A long term euro decline and dollar rally, combined with a severely lagging financial sector, spells bad news for stocks over the long run.
PLEASE NOTE: THIS IS JUST AN ANALYSIS BLOG AND IN NO WAY GUARANTEES OR IMPLIES ANY PROFIT OR GAIN. THE DATA HERE IS MERELY AN EXPRESSED OPINION. TRADE AT YOUR OWN RISK.

Monday, November 8, 2010

Euro May Have Topped, But Stocks Look Higher


The new highs in the major indices make the bullish interpretation I've been tracking for the past couple weeks well on track.  I adjusted some of the wave labels so it fits better with the big picture.  The market appears to be completing Minute wave (iii) of Minor wave C of Intermediate wave (Y) of Primary wave ((2)).  So the market subdivisions suggest some more sideways to up action on the daily/weekly charts in the coming weeks, most likely carrying us into 2011.  We're approaching a seasonally positive time for stocks after Thanksgiving and into Christmas and New Years, so timing fits well with the bullish wave count here.

Although financials have picked up some significant ground last week to the upside, in the bigger picture they still continue to lag the overall market.  And it appears the XLF has thrusted from a triangle formation which means a sharp reversal to the downside should occur soon.  Also, the euro may have topped and US dollar may have bottomed.  All these underlying elements to the overall stock market seem to be setting up a significant decline.  But we still see no signs of the uptrend breaking, and the wave count does not appear complete, so higher levels should still be expected.

"Market Manipulation" Is Not Why Most Traders Lose


Last week I noted the possible 5 wave decline in the euro after the thrust from the triangle surround the Fed's QE2 announcement.  The decline has continued from last night's Europe and Asian sessions into the US session.  Although it's declining impulsively, it's not very sharp.  We've seen these declines in the euro on the intraday charts before where it drops impulsively but not with much conviction, and it turns out to just be a correction that leads to new highs.  We'll see if that occurs here as well, but the setup is certainly in place for the bears because if the euro has topped against the US dollar then the euro she be on its way to parity; leaving the bears with a great risk/reward opportunity here.

Also note that Thanksgiving time near the end of November tends to be a very bullish time for the US dollar and has market several major reversal over the years.  So I'll keep an eye on that timeframe to see if the wave count sets up nicely for a turn, or an acceleration in the US dollar.  A significant dollar rally will eventually put a lot of pressure on stocks.


Video: The Real-Time Power of Elliott Wave Analysis

Mainstream financial analysts always look for ways to explain market action through news stories and events. Conventional wisdom states that news and inter-market correlations cause market booms and busts, but such explanations rely on selective presentation of the data. In this video, Elliott Wave International's Asian-Pacific Financial Forecast Editor Mark Galasiewski shows you how Elliott wave analysis was able to predict Hong Kong's late '90s mania and its aftermath in real time -- without looking at the news or the market's "fundamentals."

Watch More about the Power of Elliott Wave Analysis in this FREE Video
Discover how Elliott wave analysis gives you a consistently logical explanation -- and debunk one of the major myths of what caused the Asian Financial Crisis -- in the free video, "The Real-Time Power of Elliott Wave Analysis: Debunking the Myths of the Asian Financial Crisis." Access Your FREE Video Now.


PLEASE NOTE: THIS IS JUST AN ANALYSIS BLOG AND IN NO WAY GUARANTEES OR IMPLIES ANY PROFIT OR GAIN. THE DATA HERE IS MERELY AN EXPRESSED OPINION. TRADE AT YOUR OWN RISK.

StatCounter