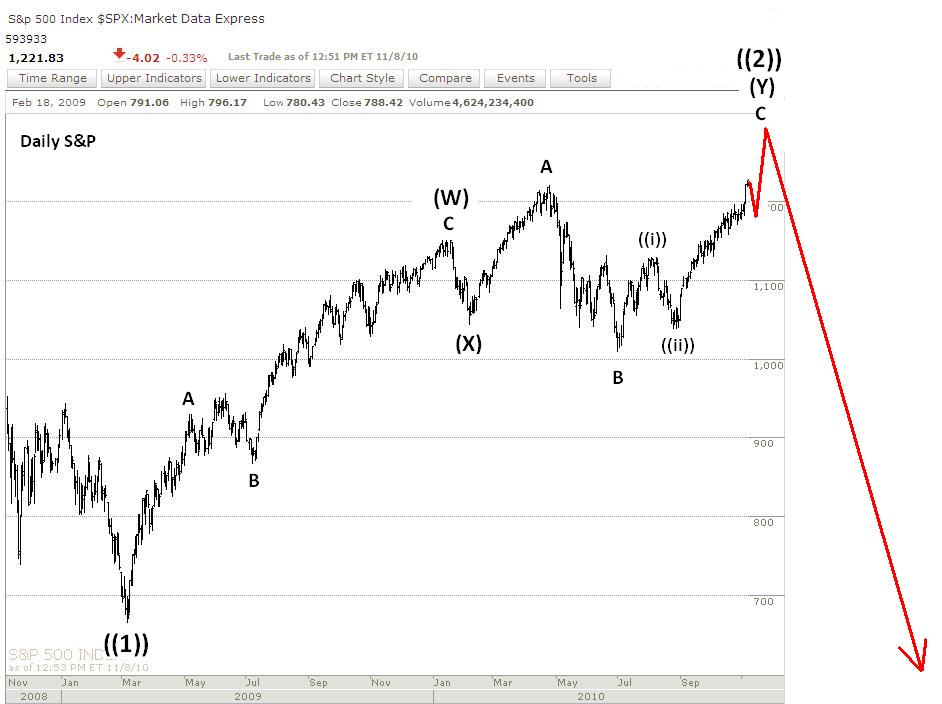
The new highs in the major indices make the bullish interpretation I've been tracking for the past couple weeks well on track. I adjusted some of the wave labels so it fits better with the big picture. The market appears to be completing Minute wave (iii) of Minor wave C of Intermediate wave (Y) of Primary wave ((2)). So the market subdivisions suggest some more sideways to up action on the daily/weekly charts in the coming weeks, most likely carrying us into 2011. We're approaching a seasonally positive time for stocks after Thanksgiving and into Christmas and New Years, so timing fits well with the bullish wave count here.
Although financials have picked up some significant ground last week to the upside, in the bigger picture they still continue to lag the overall market. And it appears the XLF has thrusted from a triangle formation which means a sharp reversal to the downside should occur soon. Also, the euro may have topped and US dollar may have bottomed. All these underlying elements to the overall stock market seem to be setting up a significant decline. But we still see no signs of the uptrend breaking, and the wave count does not appear complete, so higher levels should still be expected.
"Market Manipulation" Is Not Why Most Traders Lose

Last week I noted the possible 5 wave decline in the euro after the thrust from the triangle surround the Fed's QE2 announcement. The decline has continued from last night's Europe and Asian sessions into the US session. Although it's declining impulsively, it's not very sharp. We've seen these declines in the euro on the intraday charts before where it drops impulsively but not with much conviction, and it turns out to just be a correction that leads to new highs. We'll see if that occurs here as well, but the setup is certainly in place for the bears because if the euro has topped against the US dollar then the euro she be on its way to parity; leaving the bears with a great risk/reward opportunity here.
Also note that Thanksgiving time near the end of November tends to be a very bullish time for the US dollar and has market several major reversal over the years. So I'll keep an eye on that timeframe to see if the wave count sets up nicely for a turn, or an acceleration in the US dollar. A significant dollar rally will eventually put a lot of pressure on stocks.
Video: The Real-Time Power of Elliott Wave Analysis
Mainstream financial analysts always look for ways to explain market action through news stories and events. Conventional wisdom states that news and inter-market correlations cause market booms and busts, but such explanations rely on selective presentation of the data. In this video, Elliott Wave International's Asian-Pacific Financial Forecast Editor Mark Galasiewski shows you how Elliott wave analysis was able to predict Hong Kong's late '90s mania and its aftermath in real time -- without looking at the news or the market's "fundamentals."Watch More about the Power of Elliott Wave Analysis in this FREE Video
Discover how Elliott wave analysis gives you a consistently logical explanation -- and debunk one of the major myths of what caused the Asian Financial Crisis -- in the free video, "The Real-Time Power of Elliott Wave Analysis: Debunking the Myths of the Asian Financial Crisis." Access Your FREE Video Now.
PLEASE NOTE: THIS IS JUST AN ANALYSIS BLOG AND IN NO WAY GUARANTEES OR IMPLIES ANY PROFIT OR GAIN. THE DATA HERE IS MERELY AN EXPRESSED OPINION. TRADE AT YOUR OWN RISK.
No comments:
Post a Comment