Saturday, October 16, 2010

Everything Looks Like Big Reversals are at Hand.........Except for Stocks


Friday's internals were a little skewed with options expiry occurring.  But the down volume compared to up volume was quite noticable on the NYSE as 900 million shares traded to the downside versus 478 million to the upside.  Then, the Nasdaq Composite had even more noticable behavior in that up volume doubled down volume but the amount of decliners exceeded the amount of advancers.  So the Nasdaq's move was just heavy bets on a small amount of stocks.....primarily that surrounding Google and the big boys reporting next week.  By the way, it's about as sure of a thing as you can get that Apple will blow away earnings estimates.  Their for certain outstanding earnings report is not what's important, it's the reaction to the report that's important.  I think Apple is in a type of bubble right now, and is pulling all of tech higher in the process.  Once that bubble pops and reverses, so should the Nasdaqs.  But right now, Apple looks unstoppable, and it certainly can continue even higher and get even more so to an overbought extreme. 


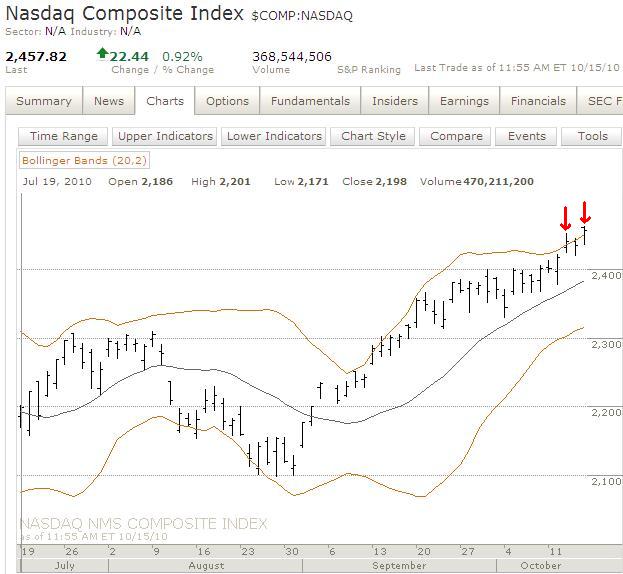
Friday morning was exciting for the bears, but as the day moved forward, the bears had little to cheer about.  The rally and very sharp reversal is exactly the type of behavior I'd like to see at this juncture if we're to think a major top is in.  But after that reversal, the bears could not accomplish anything.  And the consolidation that took place appears to be pushing higher.  So again, the bulls were able to come in and slap the bears' attack around, stopping them short of gaining any momentum in this market.  Looking at the above chart by itself, it looks like we're heading higher early next week.


There's several ways to interpret the short term wave count, but I'll post the two most obvious here.  The consolidation after the big drop looks like a triangle.  Triangles can only occur in B, X and 4th waves.  It doesn't look like a 4th wave because the decline from 1184 is too long compared to the rest of the triangle, so a 4th wave triangle seems unlikely here.  So that suggests the decline from 1184 is part of a separate wave.  That would mean the triangle is an X or B wave. 

For the bears, there I posted a scenario on the 15min chart which has the triangle part of B or X wave that will have a C wave complete wave (2).  Of course this is problem because wave (2) cannot exceed 1184 and it will be forced to come awfully close to that level in order to be valid.  Trading on such an exact move in such a tight space seems foolish to me, but I have to post it as I see it, and the B or X wave triangle looks possible here.  And hey, you never know when waves will unfold perfectly, and that consolidation definitely looks like a triangle, so we'll see what happens. 

It's also possible that a large series of waves 1 and 2 are unfolding right now, but as a personal trading rule, whenever I have to count a bunch of 1s and 2s taking place, the count is usually wrong.  If they are a series of 1s and 2s, then right out of the gate tomorrow morning the market should fall straight down. If it doesn't do that, then we can completely remove that possibility from contention.


The more bullish scenario is listed here.  Under both counts though, the short term means lower levels ahead.  But here, after one more shot lower, the market will be back in bull mode again.  If this occurs, I'll have to check out the accompanying evidence to figure out how this would best fit into the larger wave count.


The top two VIX charts show how well elliott wave principle can project future action.  Late in the week I posted those top two charts and projected the future movement as part of an unfolding impulsive rally.  The VIX fulfilled the forecast quite nicely as you can see.  It has now fallen below the area of the prior 4th wave which is typical for the end of a correction.  So a spike higher in either wave ((3)) or perhaps a C wave is now in order.  Remember that we also had a second VIX stock market sell signal execute this week at the start of that impulsive rally, so the VIX may be preparing to takeoff aggressively higher here.  For those of you not familiar with the VIX, it basically moves opposite the S&P, so a surge higher in the VIX will result in a surge lower in the S&P.

This is on of the pieces of evidence that strongly suggest stocks are at, or very near, a major reversal downward.  Unfortunately, stocks themselves don't look like they're quite ready.

Club EWI’s free report, How to Use Bar Patterns to Spot Trade Setups.

Another big sign that stocks are topping is the financials' lack of participation in this frenzied stock market rally.  The overall stock market cannot sustain a long term rally without the financials participating.  But we've seen this before where the financials lag for a while and then turn on a dime higher and erase the divergences in a week.  But that hasn't happened yet, so we play it the way we see it now.  And right now, it appears the financials may have topped and reversed early.

From a fundamental standpoint only, I wouldn't like being bearish the financials.  If in fact this weakness we're seeing is tied to the new mortgage mess that has recently surfaced, then it's just an overdone panic in my view.  Eventually, folks will realize that the Fed is the financials' stop loss and will bail them out in a heartbeat, and they can rally back quickly.  But from a technical standpoint, the financials look horribly bearish right now and I think these boys are falling much lower in the coming days.  A close below the prior swing low at 14.20 would be a good sign that a major top is in.


Above is a daily comparison in the S&P and XLF financials ETF.  You can see how badly the financials are lagging the overall market.  Why is this signficant you ask?


This is why it's significant.  The last time the financials lagged this badly was going into the 2007 top.  You can see the result there.  The financials dipped out of the stock market rally early and proved to be a big warning sign for the overall market.  So the signs of a major stock market top are here. But with that said, we've seen this happen before, and stocks continue on higher.  So we'll see what happens this time.

Trading is all about probabilities.  And the probabilities seem to suggest we're at, or very near a major top.  But no matter how sure we are, we should always enter a trade assuming we'll be wrong, and know exactly where and when to get out of that trade to remain solvent and be able to fight another day.


On top of the VIX and financials' evidence of reversal, the euro also looks really good to have started a reversal.  There was a nice reversal spike during the Bernanke speech and then a decline that went below the pre-speech runup.  On top of that, the daily close was well beneath the previous swing low that marked the most recent Bernanke speech runup, so I interpret that as perhaps a reversal in thinking.  That is, it could be a sign that the thinking about the dollar's immenent doom from the Fed's constant easing has reversed.  Watch the action in the euro.  If it has topped, a top in equities should soon follow.


And when we look at the euro wave count we can see the exact behavior and structure I'd like to see going into a major top.  We had a small degree 5 waves up complete with a sharp reversal and close to a new low in an impulsive manner so far.  It doesn't get any more perfect than this in my view. 

So again, the evidence is strong that the euro has topped, and therefore one would think stocks have topped, or will top very soon, as well. 
Just a quick note, we've been in this position before.  We've seen several markets and indicators that would suggest a top is in for stocks.  When these things line up you would logically conclude that stocks will follow the rest of the indicators and markets and reverse as well since stocks are the only holdout.  But time and time again, stocks manage to be resilient, and end up turning up those indicators and markets back into bull mode with them.  So although the evidence of a major top is compelling, we still need to be cautious.  It is also in fact possible that stocks just eek out another new high or so which the current structure suggests, and then most likely make new highs on the year which it appears they want to do right now, and the VIX not make a new low, financials continue to lag, and the euro not make a new high.  So new highs in stocks won't negate the immediate bearish view, only a reversal in the other markets I discussed here will do that.  A new low in the VIX, new high in the euro, and financials surging aggressively higher to catch up with stocks would have me looking seriously at the longer term bullish alternatives I posted earlier this week.


PLEASE NOTE: THIS IS JUST AN ANALYSIS BLOG AND IN NO WAY GUARANTEES OR IMPLIES ANY PROFIT OR GAIN. THE DATA HERE IS MERELY AN EXPRESSED OPINION. TRADE AT YOUR OWN RISK.

Friday, October 15, 2010

Nasdaq Buying is Extreme; VIX Completed 5 Wave Rally


The Nasdaq is really strong today, mainly because of Google, and not only is trading above its upper bollinger band, but it also opened above it.  This is extreme and another close above it today would signal a capitulation to the upside in my view.

How to Use Bar Patterns to Spot Trade Setups.


In yesterday's post I mentioned the VIX was unfolding in a 5 wave impulse rally and today it finished that five wave move I'm calling Micro wave (1).  If correct, a major uptrend in the VIX has begun which means a major downtrend for stocks.  Also keep in mind that this 5 wave VIX rally occurred just after the second VIX stock market sell signal executed.  So its timing is good.

PLEASE NOTE: THIS IS JUST AN ANALYSIS BLOG AND IN NO WAY GUARANTEES OR IMPLIES ANY PROFIT OR GAIN. THE DATA HERE IS MERELY AN EXPRESSED OPINION. TRADE AT YOUR OWN RISK.

Euro Count Complete, Nice Reversal This Morning


The euro moved exactly in line with yesterday's forecast by shooting to one more new high to complete wave (v), and the sharp reversal this morning suggests the five wave rise is over.  It also means that it's possible Intermediate wave (2) may be over as well.  So this is big, and the bears should be sounding their battle cries here because this may be a great shorting opportunity with stops just above this morning's high.  This reversal occurred shortly before the US futures started a slow reversal so as of now, the euro is leading equities.  So watching the euro seems wise today.  We'll see how this plays out the rest of the day.  But it looks promising for the bears as long as this morning's highs hold in the euro and in equities.

Also notice that, again, the financials (XLF) are extremely weak today compared to the rest of the market.  Just another blaring sign to the bulls that their beautiful flawless bull story is not as perfect as they hoped.


PLEASE NOTE: THIS IS JUST AN ANALYSIS BLOG AND IN NO WAY GUARANTEES OR IMPLIES ANY PROFIT OR GAIN. THE DATA HERE IS MERELY AN EXPRESSED OPINION. TRADE AT YOUR OWN RISK.

Thursday, October 14, 2010

Euro MAY Have One More New High Before a Major Top; Equities Should Decline with the Euro From There


Looking at the futures and the euro last night I was prepared to wake up this morning to another big surge higher in equities and was surprised to see a somewhat flat market.  Not only that, but the internals of the market are bearish with a lot of down volume entering the market, and so far the S&P has almost the same amount of decliners today as it had advancers on yesterday's big rally.  So there seems to be some profit taking ahead of options expiration and the Bernanke's speech tomorrow.

So the S&P appears to be in at the tail end of an ending diagonal-type pattern.  The count looks good and sentiment and momentum is certainly ripe for a nice bearish reversal here, so this remains my top count until a new high is registered.  A new high and close above yesterday's high would put the bullish alternate counts as top possibilities.  I mention those bullish alternates below. 

The main problem with the ending diagonal count is the speed and strength of the current decline so far.  After such a huge "melt up" rally and an ending diagonal, the market should be declining very rapidly.  But it's not.  It's just doing a stair-step decline.  So I don't have high confidence in this count right now, but a sharp move to the downside at any moment can change that. 

So far, there is a series of lower highs and lower lows on the short term intraday charts, which is the key characteristic of a downtrend.  But I'm far from convinced at this point that the larger trend has reversed downward.  But as along as the series of lower highs and lows continues, the above count is my top choice.   A break below wave ((4))'s low at 1155.57 will be a good sign that a top is in and lower levels will rapidly be achieved.


Looking at simple daily bars I'd like to see a close today below yesterday's low of 1171.31 to even begin to think a top is in.  Closing below this level won't confirm a top is in, but it will the first step for the bears to move toward confirmation.

Club EWI’s free report, How to Use Bar Patterns to Spot Trade Setups.


Of all the bearish evidence out there, I think the lagging financials is the most compelling.  The overall market cannot sustain a long term uptrend without financials participating.  The financials have continuued to fail to make new highs with the main indices over the past few months, and today they are struggling big time again.  When the blue chips went into the positive early this morning the financials were down almost 1%, and Goldman Sachs, often a market leader, was also down just as much.  This is a huge warning sign for the long term bulls as long as this behavior exists.


Normally I don't do counts on the VIX since I'm not sure how much it can be tied accurately to large crowd psychology, but the rally it's had off the low with a bullish reversal bar is something to watch.  A completed impulsive rally in the VIX would suggest that the larger trend was now up, and that would mean a decline in stocks.  And stocks can make a new high and the VIX not make a new low, keeping the VIX impulsive rally count intact and signaling ahead of time that a top is at hand.  Keep in mind that we're getting this impulsive looking rally right after the VIX closed outside then back inside the bollinger bands this week.  Perhaps a big warning sign for the bulls here.

With tomorrow being options expiration and Bernanke giving a speech, it could end up being a wild Friday with big moves.  If those moves happen to be to the upside then I want us to be prepared.  Above is my top alternate count on the long term timeframes.  I'm not sure about some of the larger wave degrees, but the core count is still valid.  And that means we're in one final ABC rally higher to new highs for the year before Primary wave ((2)) tops.  Judging by how stretched this market already is, I don't expect the market to exceed this year's highs by much before that top occurs.

This is my second alternate count and a little less likely than the other alternate count because projecting an ending diagonal this early is a fool's errand in my view.  So I'm going to let the market play out a bit more and prove to me this count is worth being a higher probability.  This count would make sense for many reasons, but the main ones are the accompanying internals and momentum that are occurring right now, such as the declining volume on the rise, and the 2 VIX market sell signals executing which is typical in 3rd waves and having no resultant reversal.  But there are also other reasons why it's NOT a good option, and that's because the 3rd wave looks impulsive and not a 3 wave move like it should be in an ending diagonal.  Also, the move is a bit stronger than one would expect for an ending diagonal.  These issues don't negate the count, they just make it a lesser probability at this point.

But just to clarify, these are my ALTERNATE counts.  My primary count is listed up top and is extremely bearish in the short term.  Any strong sustained rally above yesterday's highs would put these two bullish alternates in higher standing.


The euro lagged equities in making new highs the other day.  While equities surged higher in the US session the euro stayed flat.  But once the Asian session kicked off last night, the euro blasted to new highs eliminating my short term bearish count.  The delayed move higher looks like Minuette wave (iii).  The choppy overlapping grind lower in today's US session is Minuette wave (iv).  So one more new high to complete Minuette wave (v) is likely to complete Intermediate wave (2).  The result will be a sharp and massive selloff shooting the euro to parity with the dollar and probably much lower.  Once the decline in the euro starts, equities should fall as well.  But yesterday equities led the euro, so we'll see if it leads the euro lower again.

Should be an interesting Friday.

PLEASE NOTE: THIS IS JUST AN ANALYSIS BLOG AND IN NO WAY GUARANTEES OR IMPLIES ANY PROFIT OR GAIN. THE DATA HERE IS MERELY AN EXPRESSED OPINION. TRADE AT YOUR OWN RISK.


Wednesday, October 13, 2010

BEARS!!! IT'S TIME....LET ME HERE YOUR BATTLE CRY!!! (play video below)


The internals today were quite bullish but not nearly as bullish as I felt we'd have today.  Volume was very strong relative to the past several weeks but NYSE up volume was only 77% of total volume, the S&P had over 100 down stocks, and the VIX actually closed higher on the day.  Not exactly what I expected on such a feverishly big up-day with everyone doing cartwheels over their favorite Fed chief's decisions lately.


Today's late day surge in the VIX resulted in it closing back above the lower bollinger band which makes it the second stock market sell signal in less than two months without the first one being resolved with a meaningful market decline.  As I said yesterday, this is either very bullish or very bearish.  It might be very bullish because this is the type of behavior that would occur in third waves which would suggest we're in a big wave 3 up.  But it could also be very bearish because we now have two overbought extremes like this in such a short period of time with no pullback.  The other evidence in wave counts, momentum indicators and sentiment extremes suggest the bearish view is more probable.  A major market selloff is near.  I can't emphasize that enough at this point.

October Curse vs. Objective Analysis: The Choice Is Yours


While on the subject of bollinger bands; notice that just prior to the start of Primary wave ((1)) one down in the Nasdaq Composite, it closed above its upper bolling band.  Immediately after that the market underwent several months of declines that was what most people call "the credit crisis" that slashed 50%+ of value of the major indices.  Us wavers called in Primary wave ((1)).  Now notice today we have another daily Composite close above its upper bollinger band after a strong uptrend.  Will history repeat itself only this time in Minor wave 3 of Primary wave 3 down?  We'll know soon enough.


I'm not done with the Nasdaqs just yet.  Today the Nasdaq 100 exceeded its April high.  This may be the final move that sucks in even more people into the bullish camp of the overall market which is good for the bears in creating an even stronger optimistic extreme.  But the Composite is still far from exceeding its April high like the Nasdaq 100 has.  If that divergence holds, it may be significant...

...and here's why: look at the move into the March 2009 low in the Composite.  You can see that in March 2009 it went below its November 2008 low.  Now look at the Nasdaq 100 at that time period.  You can see that the Nasdaq 100 failed to break below its November 2008 low (see blue lines on the COMP and NDX charts).  So this divergence led to the massive 13 month rally (April highs) us wavers are calling Primary wave ((2)).  That's a huge rally, and the divergence in the Nasdaqs signaled that move. 

Now notice the red lines on the charts.  Now we have the opposite occuring.  The Nasdaq 100 has made a new high above its April 2010 high and yet the Composite still lags far behind.  Could this divergence between the Nasdaqs be another signal of a massive selloff on the horizon?  The surrounding evidence sure supports it.  We'll see if it holds.

EWI's Newest Service Picks ETFs: Interview with the Editor


Also, a huge warning sign for this market is the financials which are lagging the overall market badly.  They haven't even exceeded their July highs like the major indices and on today's big surge higher they barely made it into positive territory.  Also of note, Goldman Sachs, often seen as a market leader, traded down most of the day and actually closed the day negative.  And all this despite JP Morgan posting a good earnings report.  Financials lagging this market so badly is a huge warning sign for the bulls and as long as it continues it spells trouble for this market.


I'm having a problem with my charting packages today and cannot post a new chart of the euro with recent action.  But the counts still remain valid in both counts above so I'm posting them again.  The euro is trading slightly higher around 1.3960 currently.

The euro has still not made a new high throughout last night's Asian and European sessions and as I said yesterday that may be very telling.  And even if they do make new highs, it looks like it will be a 5th wave that will end the entire ABC rally I have charted above on the daily count.  Also the AUD/USD looks to have thrusted from a triangle which is a finishing move so it's also poised to fall hard soon.

So the stars are lined up more so than I've really ever seen, suggesting the major top and reversal we've been looking for keeps getting closer and closer.  Every move higher lately seems to make the markets even more and more extreme and signaling a big reversal.  With that said, there really no solid signs of that reversal occurring just yet.  So we still have to be patient.  The short term euro count suggests a top is in, but it's far from confirmed.  So we wait.  If the market continues higher, it will just make it more "shortable".  My opinion.


PLEASE NOTE: THIS IS JUST AN ANALYSIS BLOG AND IN NO WAY GUARANTEES OR IMPLIES ANY PROFIT OR GAIN. THE DATA HERE IS MERELY AN EXPRESSED OPINION. TRADE AT YOUR OWN RISK.

Hang on to Your Butts, it's About to Get Ugly....

The market is going higher, up up up up.  Nothing can stop it.  I want to dump all my short positions and go long here because it's obvious you can't fight the Fed and their artificial inflation inducements are sending this market to the moon.  Right?  I mean, the market can only go up.  It's only gone up for weeks now and I'm defeated.  The only trade here is being long.  Buy buy buy!............WRONG WRONG WRONG.  I think the market is forming a major top right now and it looks like this market is about to head down hard and fast real soon.

The S&P has reached the far end of my 1173-1181 resistance level I've been citing here for weeks.  The evidence strongly supports a major top forming at any minute.  I wouldn't be caught long here for the life of me.  But patience is a virtue here.


Above is the Nasdaq ending diagonal formation I mentioned yesterday.  The Nasdaq appears to be finishing up an ending diagonal for Subminuette wave v.  Today's gap up and "throwover" is typical of the last final move in an ending diagonal and if correct, it assures us that a sharp and deep move lower is coming very soon.  A move back underneath the upper trendline of the ending diagonal would confirm that the diagonal is over and the market is moving sharply lower.


Boy, talk about extreme.  The VIX still can't get above that lower bollinger band, and after the monster rally and surging sentiment through the roof, the VIX has now fallen off a cliff and has issued the second setup for a stock market sell signal within a two month period.  The complacency and overoptimism that it's "risk on", "the Fed won't let us lose money on stocks," and "I can only win if I buy stocks, there's no losing here so buy buy buy" is showing up across the board here.  The market feels like a big bubble waiting to get popped (those of you who loved the movie "Scarface" will appreciate the parallel of that comment to a famous line in the movie).

The market is VERY near a top.  The euro has so far failed to make a new high against the dollar and the british pound has been flat, still far from a new high.  Even though this may change soon with new highs, it doesn't negate the evidence at hand.  The feeling that the market can only go up up up is exactly the time when I want to be positioned for it to go down down down. 


PLEASE NOTE: THIS IS JUST AN ANALYSIS BLOG AND IN NO WAY GUARANTEES OR IMPLIES ANY PROFIT OR GAIN. THE DATA HERE IS MERELY AN EXPRESSED OPINION. TRADE AT YOUR OWN RISK.

Tuesday, October 12, 2010

So Far Looks Like the Fed Action was Already Priced in; Now What?


Market internals today were modestly bullish, but nothing at all what I'd expect with the Fed minutes coming out today.  Volume was just above 900 million shares and advancers/decliners were at a typical ratio for the way the market closed in my view.

Monday, Janet Yellen, the vice chairman of the Fed got some bulls a bit nervous when she appeared to dissent from the overall consensus Wall Street thought the Fed had about QE2.  In a speech, she cautioned that constantly easing monetary policy by establishing extremely low interest rates and expanding the Fed's balance sheet will lead to significant problems down the line.  So some folks may have started to doubt the whole QE2 scenario, and the Fed backstopping everyone's equity positions, so they sold off a bit yesterday into today.  But amazingly, the VIX has fallen off a cliff during that whole time, suggesting that it was just mild profit-taking, but no real fear.  So think about that, look at the intraday chart and see the sharp decline late Monday into early this morning.  And that was probably just mild profit-taking.  Imagine the decline that will occur when real fear sets in and the bulls start dumping stock because of it.  Well the market ended up declining in a 3 wave pattern over that period and then rallied today once investors saw more of a consensus, not fracturing, in the overall Fed, and that ultimately it's Bernanke that makes the decision.

But the market managed only a very slight gain in the S&P and Dow, the Nasdaqs faired a little better.  So it appears so far the Fed's actions are already priced in.  Now the details of QE2 are not on the table yet, we may not know that until the November meeting.  But for the short term, the Fed appears well on its way to establishing QE2, which in my view means that the economy is hemorrhaging so bad after all the stimulus up to this point that they have to give it another massive stimulus injection.  That's like having a brain hemmorrhage that's so bad that you have to go to the hospital for the 6th surgery to fix it, and you're happy about it.  The markets are happy about the QE2 brain hemmorrhage surgery here.  Once the QE2 nonsense fizzles, the market should fall hard.


So the VIX closed almost right at where it closed yesterday, and in doing so it closed beneath the lower bollinger band again today.  So the caution I expressed this morning can be thrown out about not reading too much into this signal because yesterday's close occurred on such light volume.  Today's close below the bollinger band confirms the setup for the signal.  Once the VIX closes above that lower bollinger band, it will again issue another stock market sell signal.  That would leave two sell signals in place in a two month period without any meaningful decline occurring.  That's either very bullish, or very bearish.  With the wave count, momentum and sentiment at topping levels right now, I'm leaning strongly towards this VIX behavior being very bearish.  This market should move down fast.  Be ready for a violent move to the downside soon.  Although I'm sure many of you already are and have been for quite some time.


The wave count is mature, momentum is still diverging slightly on the daily charts, volume remains low on almost all of this recent rally phase, there are divergences in various markets, especially with financials.  This market is forming a major top and the evidence continues to suggest a major selloff will occur once the bulls finally give up.  But the bulls have held up amazingly well so far....so we just have to wait for them to give up.  With the Fed stuff out of the way, the bulls can throw in the towel at any time now.

It appears there's some type of ending diagonal-type pattern in the indices now.  Momentum, volume and internals are diverging signficantly from the prior rally wave which I labeled Subminuette wave iii, and the rally from the Subminuette wave iv low looks weak and choppy, much like an ending diagonal, although its structure is far from perfect.  The ending diagonal formation looks more clear and probably when you look at the Nasdaq chart though, but it still tells us the same picture, a top is very near and when it occurs the move down will be fast and violent.  It's just a waiting game now.

And those of you who haven't already, don't forget to check out EWI's Newest Service Picks ETFs: Interview with the Editor and if they have anything to offer you might find of interest.


The top euro chart is that of the daily that I posted earlier Monday.  The chart below it, and directly above here, is my short term wave count.  I know it's a bit cluttered, but once we get a bit 5 wave decline I'll clean it up and eliminate the smaller subwaves.

This count can also be seen as a 3 wave ABC correction downward, instead of a wave ((1))((2)) and (1) that I labeled it here.  So it's key we keep getting lower highs and lower lows to keep this count on track and be able to lessen the likelihood of the ABC alternate from contention.  Right now I see Submicro wave (1) being corrected in Submicro wave (2).  So Submicro wave (2) needs to stop short somewhere below 1.4012.  As long as the euro stays below this level, I want to be aggressively bearish this pair.  But as a swing trader, I'm already aggressively short this pair for a long term trade.

What's also of note is that with stocks rallying to new highs in most of the major indices, the euro posted a strong rally too, but failed to make a new high as well.  And the USD/JPY and GBP/USD barely moved at all.  I thought we'd get a bigger move in currencies after the Fed minutes were released, but we didn't.  If these currencies keep their highs intact and move lower into the Asian and European sessions tonight, it may be good sign that they've topped and are moving sharply lower, primarily the pound and euro against the dollar.  And this should translate over to a big move down for stocks too.

New Elliott Wave International Article:

October Curse vs. Objective Analysis: The Choice Is Yours
'Tis the season of stock market adages; those age old Wall Street platitudes that claim stock prices perform a certain way during certain months of the year. The problem is, such correlations are hardly a guarantee. Take October, for example. Yes, this month has marked some of the darkest periods in stock market history: 1929, 1987, and on. Historically, however, it's not the worst performing month. Read more.

PLEASE NOTE: THIS IS JUST AN ANALYSIS BLOG AND IN NO WAY GUARANTEES OR IMPLIES ANY PROFIT OR GAIN. THE DATA HERE IS MERELY AN EXPRESSED OPINION. TRADE AT YOUR OWN RISK.

Market Waiting to Hear from Fed

Yesterday, blog reader Rob, pointed out that the VIX fell off a cliff and closed below its lower bollinger band.  Elliott Wave International also pointed it out in last night's newsletter.  Once the VIX closes back above that lower bollinger band it issues a short term stock market sell signal.  The last time this happened was only a few weeks ago on September 3rd and 7th.  Although the market did not selloff, it actually continued rallying higher since then.  So we will soon have two VIX market sell signals in place with no notable pullback to account for them.  Now yesterday was light Columbus day trading so I'm not sure how important this signal is.  But having two of these signals occur during a major topping process adds up to a significant development in my view.

I've read some options traders talk about how significantly bullish the VIX action is because it shows people are more comfortable with the market right now.  But in my view, at this juncture, people should NOT be comfortable with the market at all.  And that high level of comfort is what gets bulls into trouble at major stock market tops, which I believe we're at or near.


The market appears to be waiting on the Fed minutes to be released within an hour.  Once that's released, we should get some volatility back into the market.  So far the decline from the recent high is a 3 wave move, but can easily subdivide into a 5 wave impulse move.  And as long as we keep getting lower highs and lower lows, we can continue to increase our confidence in Minor wave 2 being complete.  Any further upside push above 1169 in the S&P should lead to a charge toward the 1173-1181 area before topping.

The euro has continued to decline impulsively in the short term, but on the hourly chart I only count 3 waves down, so far.  Breaking below 1.3832 last night removed the most likely alternate 4th wave triangle scenario which would have lead to a sharp thrust higher before topping.  So just like the stock market, as long as the euro continues its series of lower highs and lower lows, we cant continue to gain confidence that a major top is in and start counting the decline impulsively.

Now let's wait for the post-Fed action.....

PLEASE NOTE: THIS IS JUST AN ANALYSIS BLOG AND IN NO WAY GUARANTEES OR IMPLIES ANY PROFIT OR GAIN. THE DATA HERE IS MERELY AN EXPRESSED OPINION. TRADE AT YOUR OWN RISK.

Monday, October 11, 2010

Market Taking the Day Off for Mr. Columbus; Euro May be at Interesting Juncture Though


The stock market is doing nothing today, just floating around on light holiday trading.  But the much bigger and global 24 hour forex market might be giving us something to watch.  Above is the daily euro chart, which basically moves opposite the US dollar, and it shows a 3 wave ABC corrective rally possibly ending.  The retracement of the 5 wave decline from last November has reached the 61.8% fibonacci level, as well as my long targeted 1.40 round number resistance, the daily stochastics and RSI are overbought and waiting for a turn down, and the candlestick formation we might get today oftentimes occurs at the point of trend reversals.  So the setup is there, but it's far from perfectly bearish.


The reason I say it's far from perfect is the behavior and wave structure from the recent high that would be the Intermediate wave (2) high.  I would expect a more violent move surrounding a top of this magnitude, and then significant follow through to the downside for the kickoff of Intermediate wave (3).  This isn't a requirement, but it's certainly a guideline that I'd like to see to instill confidence in a major top.

It's possible we can chalk up the weak topping behavior to the light volume in the US session, and as the week moves on we may see some strong and violent moves to the downside like I'd expect to see if my wave count is right.  With QE2 on the table for the Fed, I wouldn't doubt if we get some violent moves this week, and as this chart shows, those moves will be to the downside.  But we'll just have to wait and see if that happens for sure since the structure and behavior right now is far from perfect. 


Regardless, there's a nice risk/reward setup here in my view.  The Micro wave ((2)) at 1.4012 acts as a good "line in the sand" for the bears.  I think any move above that level would suggest that the uptrend is still intact and that we need to wait for further signs of a top later on.  But as long as the euro stays below that level, I think we have a good chance of seeing some heavy selling in the pair come in this week.  A major top in the euro would mean a major bottom in the US dollar, and a major low in the US dollar would likely mean a major top in equities.  So this currency pair is important watch along with the 1.4012 level in my view.

PLEASE NOTE: THIS IS JUST AN ANALYSIS BLOG AND IN NO WAY GUARANTEES OR IMPLIES ANY PROFIT OR GAIN. THE DATA HERE IS MERELY AN EXPRESSED OPINION. TRADE AT YOUR OWN RISK.

StatCounter