Saturday, May 12, 2012

Stocks and Euro Obeying My Commands


Stocks have followed the short term EWP forecast for a selloff after marking a wave (ii) top at 1415.32.  Keeping it simple, and focusing on the short term, I want a stop on my short position just above 1415.32.  If the wave count is correct, stocks will be undergoing a sharp and deep selloff soon.  Wave ii has either already ended, or will make a sharp rally to the 1380 area before quickly reversing and selling off hard.  Either way, 1415.32 should remain intact and rallies should be seen as opportunities to short.  Whether Primary ((2)) has topped is irrelavent to me.  The short term is bearish, so I'm bearish.  I'll deal with Primary degree waves later if market/economic action dictates I do so.

Learn Elliott Wave Principle (EWP)


Boy, I'll tell ya, sometimes in trading I feel totally lost and other times I feel like a Jedi Knight.  Lately with the euro, I've been a Jedi Knight.  The euro has been following my forecast quite well and has been obeying my commands like a good little currency should.  The gap from Sunday night was almost completely filled, falling just 4 pips shy of my cited 1.3070 level, but still recovered sharply overnight nonetheless.  The support shelf of 1.3000 has been taken out solidly like I projected last week (Jedi), so this opens the door for 1.2600 to be assaulted next.  The daily candlestick structure March of this year is extremely toppish and has big time bearish implications for the foreseeable future.  The break down of 1.3000 is a very welcome event for the bears.  Now short term the euro is oversold so don't count out a sharp short term bounce.  But 1.3283 in the EUR/USD spot should remain intact.  I'm aggressively short against that level.  Now I will use my Jedi Knight skills on the EUR/USD......"you will decline toward 1.2600 swiftly.......(waving hand in front of EUR/USD chart).......you will decline toward 1.2600 swiftly.....(waving hand in front of EUR/USD chart)."  Consider it done!  :-)

The Manic-Depressive Stock Market: What to Make of It
The psychology of the market may be teetering on the edge...
-Elliott Wave International


Let's take our analysis a bit further in the EUR/USD.  Here's a weekly chart which I rarely show since I'm more of a short term swing trading kind of guy.  But I just wanted to show you a subtle sign of major selling ahead.  There are 3 downside gaps on this chart, and both resulted in massive selloffs immediately after them.  One resulted in a 2700 pip selloff, and the other resulted in an 1100 pip selloff.  This week's gap down is similar to these two from the past.  If history repeats itself, it means major selling is ahead of the euro.  And with the short term picture poised for major selling and an assault of 1.2600, the weekly chart here also gives us a good indicator that 1.2600 is probably the euro's next stop.  It probably won't be a straight line, so manage risk accordingly and be prepared for wild swings.  Ultimately, as long as 1.3283 remains intact, then 1.2600 should be hit soon.


PLEASE NOTE: THIS IS JUST AN ANALYSIS BLOG AND IN NO WAY GUARANTEES OR IMPLIES ANY PROFIT OR GAIN. THE DATA HERE IS MERELY AN EXPRESSED OPINION. TRADE AT YOUR OWN RISK.

Sunday, May 6, 2012

Euro Trade Update: Taking Profits on Big Gap Down


Friday I said that the EUR/USD would attack the 1.3000 and take it out soon, and it wasted little time launching its assault.  The EUR/USD gapped down big at the open today and broke solidly through 1.3000, and then had follow-through to the downside after that.  It is now trading near the low.  Gaps are usually filled so this is a great trading opportunity since I held short over the weekend and can take some profits and get back in short at a better price.  Also note on the hourly chart above that the momentum indicators like stochastics and the RSI are deeply oversold.  In preparation for the EUR/USD filling its gap, and relieving its oversold condition, I covered 25% of my short position.  I will re-enter that same short position if it rises to 1.3070, about 100 pips away from where it's currently trading.  If the euro is so bearish that it just continues lower without filling the gap, then oh well, I still have 75% of my position intact to profit from that decline and I reduced risk with a high probability trade.  That's the game, playing the probabilities and reducing risk. 

To sum up: the EUR/USD gap will probably be filled soon, meaning a rally to 1.3070 is likely within a few days, if not a few hours.  So I took off 25% of my short position and will reshort that same amount when the gap fills around 1.3070.

Refer to my my previous post below for a little more context on this trade, as well as some stock market commments.  It's also worth noting that the euro is not tanking on its own, stock futures are down 17 points (S&P), so risk aversion is hitting the markets again.  Tomorrow morning will be interesting.

Learn Elliott Wave Principle (EWP)

PLEASE NOTE: THIS IS JUST AN ANALYSIS BLOG AND IN NO WAY GUARANTEES OR IMPLIES ANY PROFIT OR GAIN. THE DATA HERE IS MERELY AN EXPRESSED OPINION. TRADE AT YOUR OWN RISK.

Friday, May 4, 2012

Euro/S&P Short Trade Still on


Below I list my projections and stop levels.  As long as the stop levels remain intact and nothing significant develops, this post will stand as guidance for the foreseeable future.

Just a quick note on the setup and count I put in last post.  I gave two options for wave (ii) and it's clear now that the latter count that had wave (ii) extending was correct.  The main point here is that my key level of 1422.38 in the S&P cash remained intact, keeping the short bias alive.  The downside turn from the wave (ii) high is just the beginning of a larger decline that should get to at least the 1300 level.   If I were to want to reduce risk I think that lowering my stop down to 1415.32 would be a wise choice for now.  But once 5 waves down complete for wave ((i)), I'll have to re-evaluate that stop and possibly take some profits.  But for now, my stop is 1415.32 for the risk averse.

Learn Elliott Wave Principle (EWP)


The euro has held my key level of 1.3384, and as you can see from the above daily candlestick chart, rallies have come hard faught while declines have been sharp and easy.  This suggests the larger trend is down.  The euro fell hard this week.  You see a set of reversal candles from a few days ago at the high which has been followed by some big red downside candles at the end of the week.  And today's close occurred on the low for the day.  That's all very bearish.  You can see that 1.3000 has been a solid line of support since February of this year, but the more it's tested the more the support is eroded.  I expect 1.3000 to be targeted and taken out next week.  I'm bearish with a stop just above 1.3384.

The Manic-Depressive Stock Market: What to Make of It

PLEASE NOTE: THIS IS JUST AN ANALYSIS BLOG AND IN NO WAY GUARANTEES OR IMPLIES ANY PROFIT OR GAIN. THE DATA HERE IS MERELY AN EXPRESSED OPINION. TRADE AT YOUR OWN RISK.

Wednesday, April 25, 2012

Stocks Look to Fall; Euro Firmly Bearish


Below I list my projections and stop levels.  As long as the stop levels remain intact and nothing significant develops, this post will stand as guidance for the foreseeable future.

The bottom line is that the S&P looks poised to fall soon.  It has either topped already with wave (ii), as seen above, or will do so with one more poke higher before turning down hard.  As long as 1422.38 in the S&P cash index remains intact, the index is very vulnerable to a big decline at any moment.  Remember, the Fed will make an announcement later today which could result in some volatility at the end of the trading day and into tomorrow. 

Learn Elliott Wave Principle (EWP)


The daily euro chart is very bearish as you can see above.  There have been several attempts to break down the 1.3000 level that have failed.  But with every attempt, more and more of the support is eroded until eventually there's almost nothing left.  The decline from 1.3384 is strong and the recovery from the 1.3000 area is choppy and weak.  I expect the euro to stay below 1.3384 and continue lower through 1.3000 quite soon.

Stock Market Turning Points: Has Wall Street Ever Warned You in Time?


The short term does not look good for the euro either.  The euro has really been laboring to make new highs since recovering from 1.3000, and the most recent high on the hourly chart was not confirmed by the RSI, suggesting the rally is weakening severely.  The Fed announcement can throw everything off quite a bit, so if you have a trade in, manage risk properly, buckle your seat belt and prepare for a possibe wild ride later today.  Overall though, as long as 1.3384 remains intact, I see the euro as very bearish.


PLEASE NOTE: THIS IS JUST AN ANALYSIS BLOG AND IN NO WAY GUARANTEES OR IMPLIES ANY PROFIT OR GAIN. THE DATA HERE IS MERELY AN EXPRESSED OPINION. TRADE AT YOUR OWN RISK.

Monday, April 16, 2012

Keep it Simple


Internals show a market that is moving around on light volume with only 734 million NYSE shares traded today. More importantly though was the fractured nature of the overall market.  Apple, and other big tech stocks, helped pull the market higher the past month or so.  But Technology failed miserably today, and has been having trouble the past week overall.  This is part of the reason why despite a solid performance from the Dow on the upside, the NYSE's up volume only slightly outpaced down volume, 387 million to 335 million.  Internally, the market looks bearish.

Learn Elliott Wave Principle (EWP)


I'm keeping it simple.  I'm not worried about Primary wave ((2)) or ((3)), and I'm not trying to make a fortune by gambling on a Primary wave ((3)) right now.  All I'm doing is focusing on the short term obvious points we have in front of us which are: 1) the market was severely overbought going into the recent weakness; and 2) you can count an impulsive decline from the high suggesting that the larger trend is down.  I would simply be shorting against 1422 with a minimum target of 1340, but probably much further.

Diagonal: Straight Shot to a Trading Opportunity


The euro seems to have made up its mind on which of my counts it's tracking.  Usually a correction goes just above the prior 4th wave high, which is 1.3225 here in the euro, before topping.  1.3400 should not be exceeded, so I'm shorting with a stop just above 1.3400.  Keep it simple, the larger trend appears to be down as long as 1.3400 is not exceeded so shorting seems wise here. 


PLEASE NOTE: THIS IS JUST AN ANALYSIS BLOG AND IN NO WAY GUARANTEES OR IMPLIES ANY PROFIT OR GAIN. THE DATA HERE IS MERELY AN EXPRESSED OPINION. TRADE AT YOUR OWN RISK.

Friday, April 13, 2012

Stocks Shaken and Movin Finally; Euro to Head Lower


As I said in last week's post, stocks appear to have topped.  I'm unsure of how major of top this is, but for the short and medium term bears, it provides opportunities.  Stocks are correcting a severely overbought situation they've been in for many weeks.  The short term is bearish.  1422 should mark the high for the foreseeable future.  I'm shorting modestly against that level.

Learn Elliott Wave Principle (EWP)


With stocks slapping me around the past several months, I've focused more on the euro since it has been more predictable, and has consistently been profitable for me.  I propose two wave counts today, both are short term bearish.  Above is my original count I was tracking for the past week or so which is still very much possible.  But today's sharp decline makes me think that it's not just a wave ((v)), but possibly a 3rd wave instead.


Here's what I mean.  By changing the degrees of trend to the Minor level, it's quite possible today's decline is the kickoff to Minor wave 3.  Now there's a lot of trading left in the day, so let's see how the euro closes before we make a decision on which count to put as top choice.  The way I see it, if the euro closes near its lows for the day, this count directly above is my top choice.  But if the euro makes a solid comeback and closes significantly higher than the lows on the day, then I'm still putting the count with wave ((v)) underway as my top choice.  Minor wave 3 should be strong and relentless, so anything short of that type of action here will put this count in 2nd place.  Either way, the short term for the euro looks bearish.

PLEASE NOTE: THIS IS JUST AN ANALYSIS BLOG AND IN NO WAY GUARANTEES OR IMPLIES ANY PROFIT OR GAIN. THE DATA HERE IS MERELY AN EXPRESSED OPINION. TRADE AT YOUR OWN RISK.

Thursday, April 5, 2012

Stocks Toppish; Euro to Decline Further


The S&P managed a new high to eliminate the head and shoulders pattern I showed in last post.  But it immediately declined afterward.  What's more important is that the Nasdaq Composite did not confirm the S&P and Dow's new highs and they all have now turned down.  The Nasdaq has been the leader of the overall market the past few months, so when you factor in that the Nasdaq is showing weakness now, the odds are good that at least a short term top is in place.  I recommend being conservative and flexible and managing risk appropriately on any short positions.  I'm not calling a P2 top or anything right now.  The focus is on the short term, and the short term suggests further weakness ahead.  I'll assess the longer term picture once the short term plays out a bit more.

I always recommend taking adavantage of free trading tools, and EWI is offering a free eBook titled, How You Can Find High-Probability Trading Opportunities Using Moving Averages, bySenior Analyst Jeffrey Kennedy.


Unlike stocks, the euro did follow my head and shoulders topping pattern I laid out in last post and has been on an assault to the downside since.  The daily chart shows that the 1.3000 level is a good support level for the moment, and it currently sits near that level at the time of writing.  Judging by the pattern I see before me, 1.3000 will be taken out farely soon.  There may be a relief pop to the upside to alleviate some of the oversold condition it has on the intraday charts.  But that pop should be short lived and the downside movement should resume to well below 1.3000.  I'm firmly bearish the euro, and bullish the US dollar.

Learn Elliott Wave Principle (EWP)


PLEASE NOTE: THIS IS JUST AN ANALYSIS BLOG AND IN NO WAY GUARANTEES OR IMPLIES ANY PROFIT OR GAIN. THE DATA HERE IS MERELY AN EXPRESSED OPINION. TRADE AT YOUR OWN RISK.

Friday, March 30, 2012

Nasdaq Erases 2007 Crisis Losses; Head Shoulders Not Just for Dandruff


The Nasdaq has made a significant new high as it has erased all the losses from the 2007 financial crisis, but more importantly it erased what was labeled as a nice 5 wave impulsive decline.  This ws important for wavers to use in order to support the claim that a much larger downtrend was in place.  This is gone now.  And this is not good for the EWP community that was following Prechter's count.  The Nasdaq's new high may signal that it is leading the blue chip S&P and Dow higher.  Usually the higher risk stocks lead the overall market so I have to be prepared for this to be the case here.  The flipside here is that the Dow and S&P have not made new highs with the Nasdaq so there is a divergence in place.  If stocks turn down hard while this divergence is in place, then it's very bearish for the overall market.  But this is less likely to occur.  I believe that it's highly possible that the Nasdaq is simply leading the S&P and Dow higher, and they too will take back all their losses from the financial crisis and erase their 5 wave declines as well.

Remember, markets are all about probabilities.  The probabilities at this point favor the bullish side.  That doesn't mean the bears are dead, it simply means that the odds favor the bulls.  I have no position in stocks right now.

Learn Elliott Wave Principle (EWP)


Focusing on the short term I see a possible head and shoulders top forming.  This means that the current rally is the right shoulder that should top around the 1414 area.  A move above the head at 1419 will negate this pattern and keep the rally well intact.  I am not shorting here though since trying to call a top has been foolish the past several weeks as many of you know.  I'll wait for an opportunity to arise and announce it here.  Until then, I'm focusing more on currencies as I've found more success their recently.


The euro appears to be forming a head and shoulders top on the daily chart.  The pattern here is much more mature and suggests a decline is coming very soon, perhaps Sunday night or Monday.  I have a small short position in place but plan to add to it if there's a strong impulsive shot lower.

What All Major Depressions Have in Common


Momentum for the euro rally on the intraday charts is not good for the bulls.  The RSI is lagging badly and has not confirmed the euro's new prices highs in a long time.  This is not a good timing indicator so this doesn't mean the euro will decline right now.  But with a head and shoulders formation in place on the daily chart, I'm shorting the first sign of weakness.  Euro bears be alert Sunday night and Monday for an opportunity.


PLEASE NOTE: THIS IS JUST AN ANALYSIS BLOG AND IN NO WAY GUARANTEES OR IMPLIES ANY PROFIT OR GAIN. THE DATA HERE IS MERELY AN EXPRESSED OPINION. TRADE AT YOUR OWN RISK.

Thursday, March 22, 2012

Stocks Put in AT LEAST Temporary Top; Euro Clearly Has Topped

Stocks have not been kind to many wavers, mainly the bearish ones.  So I'm going to be conservative in my approach here.  The stock market has been floating higher on weakening momentum and light volume the past several weeks.  Normally this results in a sharp snap back decline to allow a "restart" before continuing higher.  Or, it signals a major top will occur.  It has been very challenging trying to predict that top, and whether it will be a short term one or a long term one.

The structure right now is only 3 waves down, which is a correction.  But you need a 3 wave move to start a 5 wave move, so let's wait and see how this decline unfolds.  And you'll see I put up a quick five wave count leading into the decline to show that a top at some degree is in.  This could quite possibly the be the final impulse wave of the entire move up the past several months. 

I believe there is at least a short term top in place simply with all the other evidence suggesting this market is bloated and overbought at the moment.  Even though I'm almost guessing here, the risk/reward is solid since I can put a stop above the high on the week and expect a decline to the area of previous support at 1340.  So I'm not going to jump and call a top to Primary ((2)), or suggest a major depression is picking up speed.  No, I'm just saying that odds favor the market having put in at least a short term top this week and the risk/reward favors the bears here.  Keep it simple, keep it short term.....for now.

The Three Phases of a Trader's Education


The euro, on the other hand, has been kind to bearish wavers since it has more or less followed my wave count.  Wave (c) of ((ii)) ended up deeper than I expected so I had to adjust waves (iii), (iv) and (v) to give it a better look.  But it all fits well.  This count suggests the euro's next move should be down big.

Learn Elliott Wave Principle (EWP)


And drilling down even further for the euro we see one of my favorite trading patterns; a head and shoulders top.  When you combine this formation with the wave count above it, you have a very bearish and tradeable outlook for the euro moving forward.  I'm pretty heavily short the euro right now myself.

Are the Efforts of the World Central Banks Working?


PLEASE NOTE: THIS IS JUST AN ANALYSIS BLOG AND IN NO WAY GUARANTEES OR IMPLIES ANY PROFIT OR GAIN. THE DATA HERE IS MERELY AN EXPRESSED OPINION. TRADE AT YOUR OWN RISK.

Friday, March 16, 2012

Heading into Next Week; Stocks, Euro Discussed


Today was options expiration day for the first quarter so volume was quite heavy, yet the net result in price was almost neutral.  Not much to obtain from internals today with that in mind.


In looking for resistance, I see the 1400-1410 level as a great reversal point.  It's a previous congestion area from a few years ago, as well as a round number.  Above 1410 we have a nice zone between 1425-1440.  Although I doubt the market will make it that high, it's still worth watching in case it does.  Right now, I'm still waiting, no trades in.

Which Method Can Traders Use to Confirm an Elliott Wave Count?


Wave (v) is currently trading at the 61% fibonacci relationship of wave (i).  Oftentimes, 1st waves will equal 5th waves, or some fibonacci combination of the 1st wave.  So again, there is another nice piece of resistance here that could repel this market toward a major selloff.

But with no solid evidence that a top is in place, we have to respect that the trend is still up for now since there is a well defined series of higher highs and lower lows.  We need to see that trend break down, preferably with a nice reversal pattern near the resistance levels I cited, before I will take a short position.  Until then, I will remain on the sidelines.

The Three Phases of a Trader's Education


The euro is tracing out the flat correction I put in my last post.  Although flat corrections for 2nd waves are rare, it's still possible here.  The sharpness of the rise also coincides with the wave (c) labeling since C waves are impulses and therefore very strong.  I expect the 1.3200 area to cap the rally, but if it doesn't and it follows through to the upside, then another pattern is probably forming.  Most likely it will mean that the 1.3000 level was reached by a 5th wave ending diagonal instead of a (b) wave like I have labeled above.  If correct, then there's certainly room for a lot more upside.  But 1.3485 remains the line in the sand for the bearish count regardless.  As long as that level remains intact, I'm bearish the euro.


PLEASE NOTE: THIS IS JUST AN ANALYSIS BLOG AND IN NO WAY GUARANTEES OR IMPLIES ANY PROFIT OR GAIN. THE DATA HERE IS MERELY AN EXPRESSED OPINION. TRADE AT YOUR OWN RISK.

Tuesday, March 13, 2012

Stocks Float Higher; Euro Struggling

I'm not posting any stock charts tonight.  EWP has not been accurate in forecasting stocks the past several weeks and some people have expressed anger and great frustration with EWP and me, and judging by the hate mail I've been getting I think most of them simply look at the charts and don't read what I say.  So I'm going to only post words for stocks tonight.  This anger and frustration some people are feeling is usually because they are new to trading and fail to understand that no analysis is 100% accurate all the time, and it's up to the trader to determine when the probabilities, along with risk/reward ratios, are in their favor to determine when a trade is worth making.  Professional and successful traders don't have to always have a trade in place, and don't have to always know which direction the market is going.  Trading is about probabilities and risk/reward ratios, and when they're in your favor then you trade, when they're not in your favor you stay away.  Right now, EWP is not in our favor for stocks, so I'm staying away until a nice reversal pattern forms.  EWP's accuracy for stocks will return, and I'll continue to make money on swing trades when it does.


Now EWP and basic technical analysis has been much more accurate with the euro lately so that's why I've been actively trading it and am currently short right now.  The euro has declined impulsively from its high at 1.3485, and so I will bearish until price goes above that level.

There are two wave count options I see for the euro right now.  The first is posted above where wave ((i)) has completed and it is about to undergo wave (c) rally within a "flat" correction for wave ((ii)).  The story here overall is still bearish, it's only in the very short term I have to expect a sharp wave (c) rally to around the 1.3200 level before it tops and reverses.


The other option is that wave ((ii)) has already completed, and a big strong wave ((iii)) down is now underway.  If correct, the euro will not hestitate to shoot lower this week.  If correct, this is a move I don't want to miss, so I have sell stops in place to catch a break out to the downside.  Utlimately risk is capped for the bears at 1.3485.


PLEASE NOTE: THIS IS JUST AN ANALYSIS BLOG AND IN NO WAY GUARANTEES OR IMPLIES ANY PROFIT OR GAIN. THE DATA HERE IS MERELY AN EXPRESSED OPINION. TRADE AT YOUR OWN RISK.

Thursday, March 8, 2012

Stock Decline Looks Corrective; Euro Finishing its Own Correction


Internals today continue to support the bigger bearish picture in that volume is not supporting the rally and therefore the rally has no legs over the long haul.  However, in the short term, the wave structure indicates a new high is probably coming before a major reversal occurs.  Volume declined again to 715 million NYSE shares on a rally move today which is far less than the 876 million shares that accompanied the decline earlier in the week.  Unfortunately for the bears though, 876 million is still a small number overall.  I'd like to see volume break 1 billion to gain confidence in future direction.  Most likely that type of volume will occur on a huge down day in price.

Which Method Can Traders Use to Confirm an Elliott Wave Count?


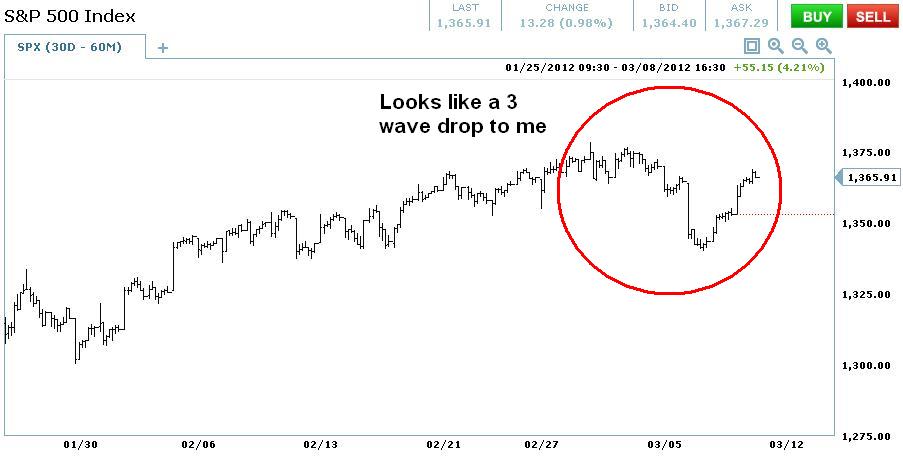
Although I'm short now and am looking aggressively for shorting opportunities only, I can't overlook the fact that from an EWP perspective, the recent decline looks like a 3 wave drop which is a correction.  No worries though, it was probably just one of the fakeouts I mentioned would probably occcur as a major top forms.  Patience rules the day.  Once I notice a high confidence reversal pattern is in place, I'll mention it here.  Until then, I'm waiting to add short.

Learn Elliott Wave Principle now while EWI is offering a free online edition of Bob Prechter's Elliott Wave Principle - Key to Market Behavior.


The euro is probably correcting in a wave (iv) as I labeled above.  If correct, it needs to fall almost immediately because wave (iv) is getting a bit stretched relative to wave (ii).  Prolonged rallying probably means I have this mislabeled, but the alternate counts are still very bearish.  Bottom line, look for the euro to continue lower soon. 

Who's Going to be President? Ask the Stock Market.


PLEASE NOTE: THIS IS JUST AN ANALYSIS BLOG AND IN NO WAY GUARANTEES OR IMPLIES ANY PROFIT OR GAIN. THE DATA HERE IS MERELY AN EXPRESSED OPINION. TRADE AT YOUR OWN RISK.

Tuesday, March 6, 2012

Today's Weakness is a Good Opportunity for the Bears; Euro Trend is Firmly Down


Today's reversal was decent from a bearish perspective since the decline is unfolding impulsively after the market internals and momentum are beyond stretched and tired.  This suggests more downside is to come.  Also, down volume was 95.7% of total volume on the NYSE today, so it was all selling all the way today.  Looks like a lot of profit taking of people who have done well on the recent rally and want to reduce risk here at these levels.  So all it takes today or tomorrow is a small fear jolt and this delicate market will crumble as those who didn't exit yet but are thinking about it, will rush for the exits and take profits at the next sign of trouble.  Total volume increased by 25% today compared to yesterday, which is good for the bears, but overall it's still a very light number so let's not do a cartwheel just yet.  I doubt a major top like the one labled in EWP below will occur this easily, so be prepared for some fakeouts and disappointments.  Always manage risk assuming you're wrong whenever you place a trade.

Learn Elliott Wave Principle now while EWI is offering a free online edition of Bob Prechter's Elliott Wave Principle - Key to Market Behavior.


In addition to total volume being a bit light for such a major top perhaps forming, another piece of evidence isn't exactly very bearish.  You can see that today's decline is sitting right on an ascending trendline established from late last year.  The market may bounce from that trendline tomorrow, but ultimately it should crash below it and open the door to the possibility of heavy selling.  A nice close beneath this trendline in an impulsive structure would be a great sign that top is in.  I shorted small already since the risk/reward is so favorable here, and because I've been on the sidelines for so long.  But I will pile on the short side more and more as the evidence mounts that a top is in fact in place.

R.N. Elliott Discovered the Wave Principle Over 70 Years Ago


The euro followed the wave count I put up yesterday as it continued lower it what is probably a wave v within wave (iii).  As long as the euro continues following the basis of this wave count I will continue to use it and trade with it.  3rd waves tend to do whatever they want, and they often extend, especially within their 5th wave which the euro is in right now.  I'm holding short, expecting lower levels for the euro in the days ahead.

Who's Going to be President? Ask the Stock Market.


PLEASE NOTE: THIS IS JUST AN ANALYSIS BLOG AND IN NO WAY GUARANTEES OR IMPLIES ANY PROFIT OR GAIN. THE DATA HERE IS MERELY AN EXPRESSED OPINION. TRADE AT YOUR OWN RISK.

Monday, March 5, 2012

Still Waiting For Stocks to Make Tradeable Move; Euro Has Opportunities


Nothing has changed from my post, charts and the wave count remain static.  I'm still waiting for a reversal pattern and impulsive move to the downside so I can establish a position.  I've been on the sidelines for weeks now, simply waiting.  Volume continues to be light with today barely breaking above 700 million NYSE shares.  Tough to trade with volume like that, unless you're a daytrader which I am not.  One of many signs that this rally has no legs is that volume has left a long time ago.  The next move of consequence to provide traders a good solid opportunity should be to the downside.  But we have to wait until the market is ready.  But I'm on high alert....looking for signs of a reversal, knowing that many others are doing the same so there will probably be a fake out or two to the downside before the real heavy selling gets underway.  So as always, I'll be managing risk appropriately and looking for a shorting opportunity.

Learn Elliott Wave Principle while EWI is offering a free online edition of Bob Prechter's Elliott Wave Principle - Key to Market Behavior.


The bottom line is that the euro appears to be falling impulsively.  Being so early in the decline makes it hard to determine the degrees of trend with high confidence, but the subdivisions of the move is undoubtedly impulsive nonetheless.  So the path of least resistance for now is down.  The euro should not exceed 1.3485 in the near future, so shorting with stops just above that level seems like a good opportunity to me, especially if a big rally occurs from current levels which would allow me to short at a better price.

Who's Going to be President? Ask the Stock Market.


PLEASE NOTE: THIS IS JUST AN ANALYSIS BLOG AND IN NO WAY GUARANTEES OR IMPLIES ANY PROFIT OR GAIN. THE DATA HERE IS MERELY AN EXPRESSED OPINION. TRADE AT YOUR OWN RISK.

Tuesday, February 28, 2012

New Highs Slap Wavers....AGAIN; Euro Correction Looking Clearer


I haven't posted anything in a while because there was nothing new to add from my last post.  The market has continued the slow grind higher with no clear signals to establish a tradable position in my view.  But this week the S&P confirmed the Dow's new high, which is a significant event, and therefore the reason I'm writing today.  The major bearish setup was that the Dow made a new high while the S&P did not, so any sharp downturn would be a great signal for the bears to jump in short for what could have been a major selloff.  But that setup was negated with the new high.  It means again, wavers were wrong in calling Primary wave ((2)) complete, and again we have to look higher and continue stretching out the count.  It has been tiresome and frustrating to say the least.

Although I have not taken a position for quite some time since I thought the best move was to get short when opportunities arose.  But the fact that I missed this long gring higher frustrates me.  Again, I find myself standing on the sidelines with no position, simply waiting for an opportunity to get short.  It won't be easy at this point.  I expect volatility to pick up when a top starts forming, and most likely at least one fakeout will occur.  So I'll remain disciplined and keep risk tight when trying to catch a top and short this market.  But for now, it's a waiting game.

Don't forget to take advantage of free forex analysis from EWI until tomorrow! 


The euro's correction seems a little more clear now.  It's completing a Minor A-B-C corrective rally with wave B tracing out a nice flat correction, and wave C tracing out a nice impulse pattern with a wave ((iv)) down and wave ((v)) up to complete the entire corrective pattern.  Once we get a new high, I'll be looking to get short this pair on any reversal pattern.  Stocks MAY follow soon after.

Forex Market Insight: EUR/USD Rallies...Why?

PLEASE NOTE: THIS IS JUST AN ANALYSIS BLOG AND IN NO WAY GUARANTEES OR IMPLIES ANY PROFIT OR GAIN. THE DATA HERE IS MERELY AN EXPRESSED OPINION. TRADE AT YOUR OWN RISK.

StatCounter