Thursday, April 14, 2011

After 5 Waves Down, Stocks and Euro Look to Rebound


Volume remains light in the market, making it tough to get a definitive consensus of trend. Volume today was still well under 1 billion shares on the NYSE, so although there was a bullish reversal today, the light volume doesn’t make it a convincing reversal…..probably will result in just a day or two of rallying.

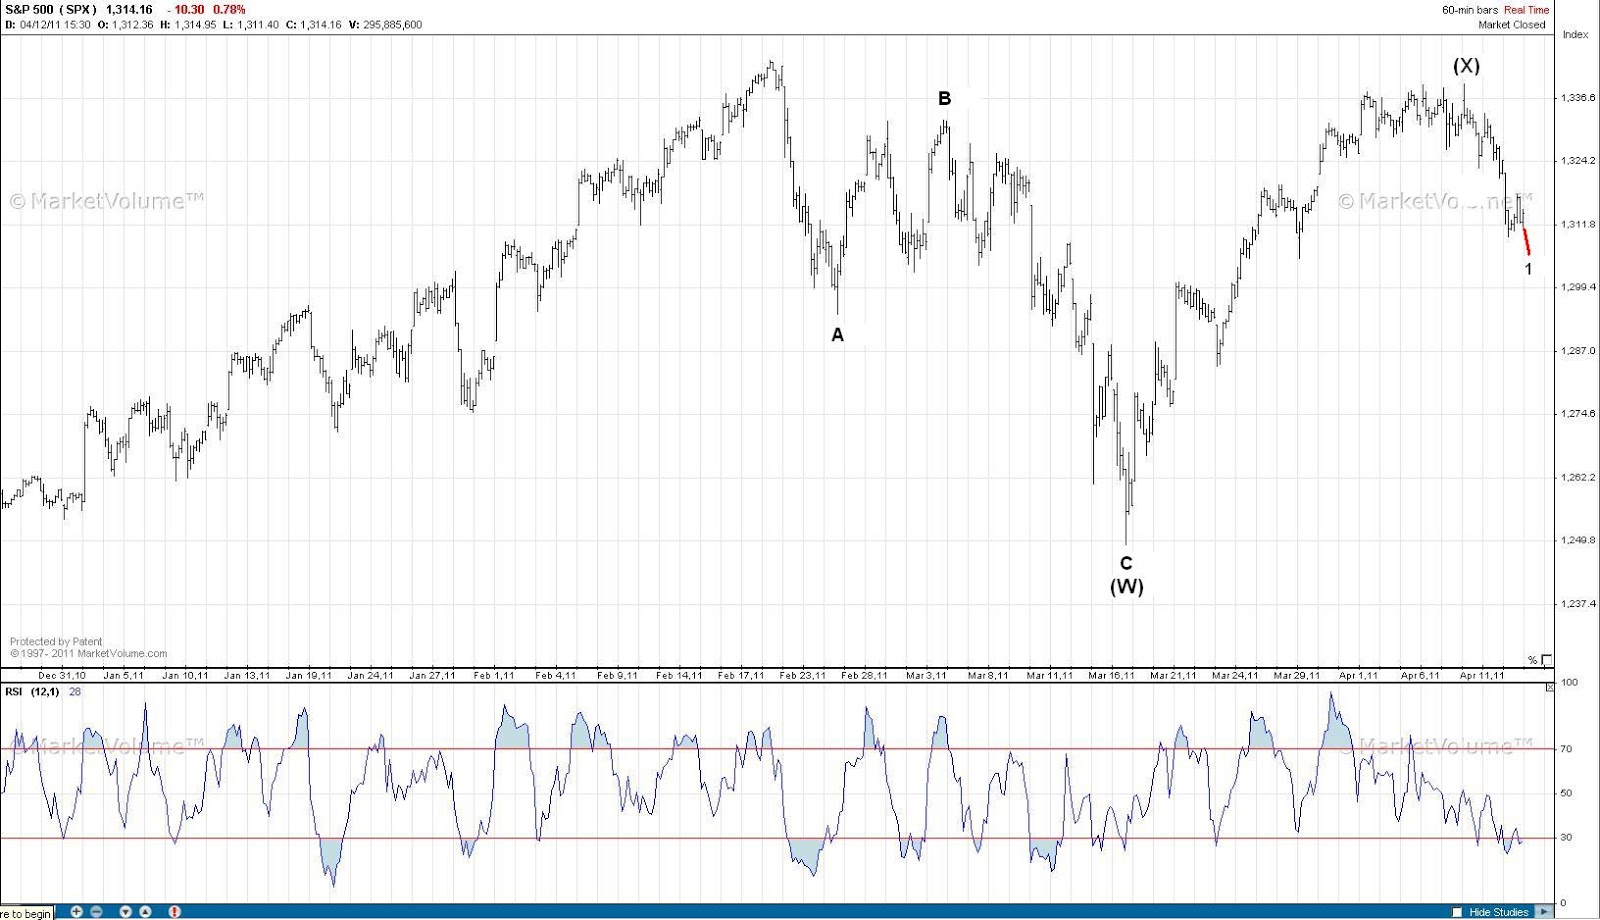
Looking at the wave count I’ve been tracking the past several weeks we can see that things are falling into place so far. I’m unsure of the degrees of trend here since the above degrees don’t fit well into the larger wave count, yet the magnitude of the moves shown here do in fact fit well with the degrees I plugged in here. So there’s conflicting issues here as far as degree goes so remain flexible in that respect.
Today we saw a nice bullish reversal since the market opened very weak and made a new low and then rallied all day and closed in the positive. But the damage has been done to the bulls since a nice 5 wave decline was printed with the action over the past few days. This suggests that the current reversal is the start of wave (ii) that should last Friday and probably at least some of Monday. The market should stay below the wave X high and eventually turn lower sharply with wave (iii) probably early next week. Ultimately, the Wave W low should be broken, which is a significant decline despite it just being part of a correction.
Learn Elliott Wave Principle


Looking at the daily chart you can see that this latest rally has been done on very weak momentum as shown by the declining volume (also seen clearly on the SPY and NYSE) and RSI. This alone is about enough I’d need to see to be getting very conservative as a bull at a minimum. But I’m not a bull, so I don’t have that problem. The only reason I feel this is just a WXY combination correction unfolding is because the drop from the high on the year is clearly a 3 wave move, which means unless that high is broken then this entire move is most likely corrective all around.
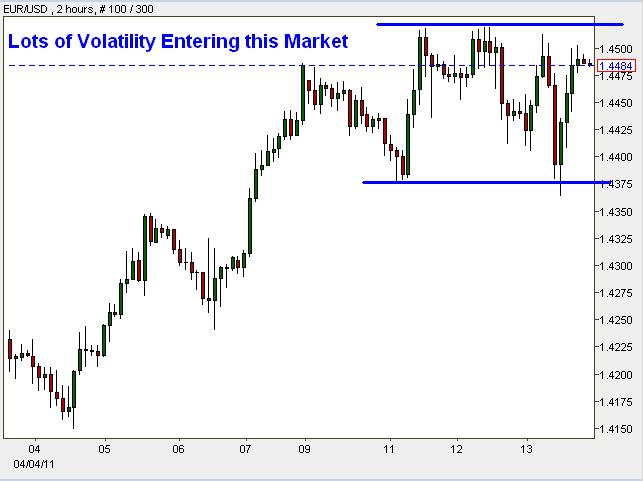

The euro’s wave count eludes me in the short and medium terms. But the long term count shows a clear downtrend. So I have a bearish bias and am currently short right now. The increase in volatility is a good sign a top is near, if not already in. A breakout should ensue soon and I feel that a breakout to the upside will probably be sharp, but short lived and sharply reversed. A breakout to the downside should result in massive US dollar short covering, sending the euro lower in a hurry. So to me, the best place to play this pair is on the short side when opportunities arise.

PLEASE NOTE: THIS IS JUST AN ANALYSIS BLOG AND IN NO WAY GUARANTEES OR IMPLIES ANY PROFIT OR GAIN. THE DATA HERE IS MERELY AN EXPRESSED OPINION. TRADE AT YOUR OWN RISK.

Wednesday, April 13, 2011

Stocks Still Floating Around, but the S&P and Euro Declined in Five Waves


Volume is still light and stocks continue to flop around directionless.  However the wave structure may give us a clue as to a what the larger trend may be.


The S&P eeked out a 5 wave decline suggesting the larger trend is now down.  Unfortunately it's occurring with weak volume and mediocre internals to the bearish side.  So it's not a convincing picture....but it rarely is I guess.  The evidence is strong enough that the rally has exhausted, so I'd short rallies with a stop just above this week's high if I was an aggressive trader.  The market is trading heavy overall, and with a 5 wave decline on our hands, a bearish bias in the short term is warranted.

Learn Elliott Wave Principle


The euro has also declined in 5 waves, although more sharply and convincing than the S&P.  Here too I favor the short side.


PLEASE NOTE: THIS IS JUST AN ANALYSIS BLOG AND IN NO WAY GUARANTEES OR IMPLIES ANY PROFIT OR GAIN. THE DATA HERE IS MERELY AN EXPRESSED OPINION. TRADE AT YOUR OWN RISK.

Tuesday, April 12, 2011

Stocks Breaking Down, but Still no Volume


Stocks fell hard this morning, accompanied by solid volume on the decline.  But unfortunately that's all the bears could do.  Stocks rallied on soft volume the rest of the day.  So the closing NYSE volume number today is a bit deceiving since it's very light for the day overall, but what you don't see is that the early decline this morning had strong volume.  I would have liked to see a close today with 1.2 billion or more shares traded, but perhaps we'll get that tomorrow.


Stocks appear to be falling impulsively but we can't conclude that quite yet.  We still need one more new low to make a nice 5 waves down complete.  But the S&P must stay below 1322.94 to keep the nicely formed impulsive decline intact. 

As for the euro, it rallied sharply despite stocks losing ground this morning but then the euro reversed sharply and never recovered.  This looks like a nice reversal pattern and is worth shorting.  So I shorted the euro this morning with a stop at last night's high.

Everything You Ever Wanted to Know About the Elliott Wave Principle, Free

PLEASE NOTE: THIS IS JUST AN ANALYSIS BLOG AND IN NO WAY GUARANTEES OR IMPLIES ANY PROFIT OR GAIN. THE DATA HERE IS MERELY AN EXPRESSED OPINION. TRADE AT YOUR OWN RISK.

Monday, April 11, 2011

Stocks Look Vulnerable Here


I’ve been talking about how weak the rally looks internally the past few weeks and how I’m looking for volume to re-enter the market to give us some momentum in either direction.  I didn’t want to take a position randomly because I know how the market can easily just float higher and higher and higher on light volume for several weeks.  And that’s exactly what it has done.  But now the daily price action is starting to match the weakness the internals have shown the past few weeks.  Today’s internals continue that trend with a measly 817 NYSE shares traded, but decliners well exceeded advancers by 1,178; a bearish indicator here.
When volume returns, it should move this market sharply.  If it shoots higher with that volume, I believe it would be a capitulation move, not the start of the next rally leg lasting months.  So it should be capped and reversed in fairly quick order.  I wouldn’t short into the rally, I would simply get out of its way and let it run its course and wait for signs of a top.  Then I’ll try shorting against a recent swing high.  The other option is that the market just shoots lower from current levels either Tuesday or Wednesday this week.  If so, and volume increases on the decline, I’d short into that weakness. 
Earnings Season: Strong Earnings Mean a Strong Stock Market -- Right?


With a clear 3 wave drop from the high on the year the only accurate way to count this is an ABC decline within a larger correction, most likely a WXY combination.  The market should soon be undergoing another 3 wave drop to form wave (Y).  Making a new high on the year would negate this count from contention and most likely mean the 3 wave decline was simply an ABC zig-zag correction within a larger 4th wave.  But under this scenario, the market would soon top and reverse anyway.  So I favor the short side now and am looking for an opportunity to get short. 
Everything You Ever Wanted to Know About the Elliott Wave Principle, Free


The daily S&P chart tells a grim picture for stocks.  Volume has fallen significantly as the market has risen, suggesting the rally has little teeth to it and that it’s most likely just a correction [which I’m labeling Wave (X)].  Also notice the RSI has already reversed and has been headed lower for days while price has consolidated.  I can’t emphasize enough how weak this market looks right now.  But without any solid evidence of a top, we have to expect it to float higher….and continue to wait.


The euro count eludes me for the short and medium terms.  The larger downtrend count remains intact though so I want to look for shorting opportunities.  A reversal day, sharp decline and/or an impulsive move lower would get me to attempt a small short position.  Aside from that, I’m on the sidelines here.

PLEASE NOTE: THIS IS JUST AN ANALYSIS BLOG AND IN NO WAY GUARANTEES OR IMPLIES ANY PROFIT OR GAIN. THE DATA HERE IS MERELY AN EXPRESSED OPINION. TRADE AT YOUR OWN RISK.
Tuesday, April 5, 2011

Market Looks Weak, but will the Rally Stop?


This market is a snoozefest for a sidelined bear.  Internals continue to be lethargic, but price continues higher anyway.  Today's NYSE volume was a whopping 829 million on a flat day.  Very few traders have any interest in the markets right now.  And I'm one of them.  I still feel that when volume returns, we need to watch the price action and follow the herd, whichever way it's going.  Until then, I'm avoiding this thinly traded market right now.


Above is the S&P SPDR (SPY) illustrating the weakening momentum with volume increasing on the decline and decreasing on the market's rally.  Also note that the RSI has a bearish divergence in place and suggests at least a short term pullback is just ahead.

Learn Elliott Wave Principle


Lastly, the major indices are diverging at the moment creating yet another bearish setup and opportunity for the bears to smack this market down, if they want to.  So far the bears have failed to muster up any strength, and when they have, they have failed to sustain it.  But above you'll see that the Dow has made a new high yet the Nasdaq Composite and the S&P has not.  As long as this divergence remains in place, the market is very vulnerable to sell off.  I personally would wait for some signs of a top, like an impulsive decline or midday reversal.  But for the gamblers out there, shorting the S&P or Composite with stops just above their highs would be a gamblin move perhaps worth taking.  But it's just that at this point......a gamble.

I've been having computer problems lately and have been working long days on a big project so I probably won't be back unless something significant happens in the market the rest of the week.  But I'll be back to normal posting next week.


PLEASE NOTE: THIS IS JUST AN ANALYSIS BLOG AND IN NO WAY GUARANTEES OR IMPLIES ANY PROFIT OR GAIN. THE DATA HERE IS MERELY AN EXPRESSED OPINION. TRADE AT YOUR OWN RISK.

Wednesday, March 30, 2011

Market Continues Rally on Low Volume, but Danger Lurks


The internals today show the same picture we’ve been seeing the past week or so in that volume has been very light on this current rally leg. Today we had an uptick in volume relative to the previous trading days, but still light overall at 918 million NYSE shares. I don’t think the uptick today means much, other than typical midweek trading kicking up the volume bars a bit. Getting above 1.15 billion shares will get my attention though.


Unfortunately for the bears, the rally is starting to look quite impulsive. It’s quite a smooth and clean looking rally that has now gone quite deep. I still count the decline from late February as a 3 wave ABC move. An X wave, which is how I am counting this current rally, should be a bit choppier and composed of a 3 wave ABC move itself. But right now I’m not seeing it. Regardless, with very light volume throughout this rally, and the RSI in a position now that it has been at in the past when a decline was near, I’m on the lookout for a good short term shorting opportunity coming very soon. I’d like to see an up day that is reversed during the trading day with solid volume to support it. I’d get short with a stop just above the high on the day if that occurs. Other than that, an impulsive decline on high volume at any time would also get me on the short side. Until I get that, I’m waiting on the sidelines.

Learn Elliott Wave Principle


This chart of the S&P SPDR (SPY) shows what I’m talking about when I mention volume is declining as the market rallies. This is typically a bearish development, but it can continue doing this for quite a while. So I want to wait for signs of a top and reversal before attempting to short.


Lastly, the Nasdaq 100 has a rally that looks the most like a nice developing 5 wave impulsive rally. If correct, the overall stock market probably has already bottomed and the bull trend has resumed. This conflicts with the evidence I’ve listed above on the S&P though, so we’ll have to wait and see which side prevails here. So watching volume in the overall market, and the wave structure in the S&P and especially the NDX, seems like a good idea to help us establish a high confidence low risk trade in the near future.

Still Enough Time to “Conquer the Crash”


The euro is flip-flopping around directionless this week and so the wait continues. So far there is only a 3 wave decline from the high which suggests it’s only a correction. But a 3 wave decline can easily develop into a 5 wave move as long as no rules are broken. So staying below 1.4219 would keep the possibility open for a 5 wave decline to develop from here. Breaking above 1.4219 would mean new highs were on the way soon.


PLEASE NOTE: THIS IS JUST AN ANALYSIS BLOG AND IN NO WAY GUARANTEES OR IMPLIES ANY PROFIT OR GAIN. THE DATA HERE IS MERELY AN EXPRESSED OPINION. TRADE AT YOUR OWN RISK.

Tuesday, March 29, 2011

Stock Volume Suggests Selloff Lumes; Euro Bears be Ready


Internals today tell us that this market is still flip-flopping around with an upward bias on light volume. Today’s volume was greater than yesterday’s, but still very light overall at only 804 million NYSE shares traded today. Once volume comes back into the market, we should have more confidence in riding a trend for a few days at least.


The S&P is not only moving higher on low volume, but also on diverging relative strength as seen through the RSI above. This paints another picture of weak momentum on this move higher. But, the market can still float higher on this weak momentum just as it has done the past several days, but if we get a big volume spike on a nice reversal day to the downside, or accompanied with an impulsive decline, then I think it will be a golden opportunity for nice short trade. So I’m still waiting and watching for the next big move on high volume.

Learn Elliott Wave Principle


If we put EWP aside for a moment and just look at the behavior of volume lately we can see what should be a concerning picture for the bulls. Above is the S&P SPDR the SPY. Notice how volume increased with the SPY’s decline, then fell off sharply when the market rallied. This tells me it’s probable that the larger trend is probably still down despite this long rally we’ve had the past couple weeks. So this is one of the things I’m watching that has me all over this volume issue.

Still Enough Time to "Conquer the Crash"


The euro hasn’t done much all this week. I think the risk/reward lies with the bears here so I’d be short against 1.4219. At this point, a break above 1.4219 would make the decline from the highs on this chart a 3 wave move which is a correction, and point to higher levels for the foreseeable future. So staying below 1.4219 keeps the bearish view intact with substantial rewards possible if the larger downtrend has in fact resumed.


PLEASE NOTE: THIS IS JUST AN ANALYSIS BLOG AND IN NO WAY GUARANTEES OR IMPLIES ANY PROFIT OR GAIN. THE DATA HERE IS MERELY AN EXPRESSED OPINION. TRADE AT YOUR OWN RISK.

Monday, March 28, 2011

Still No Volume, But is Today's Reversal in Stocks Significant?


Friday's upday was accompanied by even lighter volume than the previous light volume day.  I think it was around 820 million NYSE shares Friday.  But the bears have not taken advantage of the thin bearish momentum and the market continues higher.  This is not the behavior I'd expect to see at a major trend change.  And with the S&P gap filled I would have liked to see a reversal quite soon, but it's not happening.  This is why I put the WXY combination count as top choice late last week.  I can still eye the WXY combination correction with the market being in the X wave right now, but with the series of higher highs and higher lows well intact, there's no reason to get short here in my view.  Although momentum is hallow, it's still up.  Until that uptrend is broken, I'm on the sidelines.  The market is in the middle of a prior congestion zone so it may staul a bit here.  It's reaction off the congestion zone will be important.  And whichever way the market moves when volume re-enters the market should define the trend for the next several days.

The euro looks like it might be starting an impulsive decline but it's too early to confirm it.  Looking for short opportunities in the euro, and long the USD, seems like a wise choice here.


Today we had a nice stock reversal at the end of the trading day which was really nice to see since the S&P is trading at the heart of a congestion area I'd like to see hold as resistance, and shortly after filling a gap at 1320.  You can see the internals above show a bearishly slanted market by the advancers vs decliners and up vs down volume despite the fact the market was in the positive most of the day.  The biggest problem here though is volume.  There was none today.  The NYSE had only 783 million shares traded, even lower than Friday's number.  So volume continues to decline every day.  So I don't have much confidence in this late day reversal......yet.

Like I've said before, the key is to watch for volume to enter the market again.  Whichever way the market moves on high volume (preferably over 1.1 billion NYSE shares at least) should define the trend for the coming days.

Learn Elliott Wave Principle


The daily S&P chart shows a nice reversal pattern in the candlesticks.  But unfortunately since there was no volume to support for this formation, it makes it less reliable.  It doesn't mean we should ignore the signs of today's reversal, we just need to be cautious if going short here.  I personally am waiting for volume to return, or a clear 5 wave decline before I get short stocks.

Still Enough Time to "Conquer the Crash?"

The euro didn't do much today to report on.  It looks like it may have formed a significant top and has completed the early stages of a large impulsive decline.  I'll post a chart with a count when I have high confidence in its labeling.  But I'd still favor the short side on short term trades here.

PLEASE NOTE: THIS IS JUST AN ANALYSIS BLOG AND IN NO WAY GUARANTEES OR IMPLIES ANY PROFIT OR GAIN. THE DATA HERE IS MERELY AN EXPRESSED OPINION. TRADE AT YOUR OWN RISK.

Thursday, March 24, 2011

Bulls Making a Run - but on No Volume


The bulls are still making a go at pushing this market higher and have obviously been successful doing so the past few days.  Today the S&P did not break below my key level I mentioned yesterday at 1284.05, so I remain neutral.  The series of higher highs and higher lows remains intact therefore so does the uptrend.

Despite the bulls seeming to be in full control of this market according to the price action, they are doing it on very light volume, and almost every day the market moves higher while volume moves lower.  This diverging behavior is bearish and suggests the market will give way to a big downside move once volume re-enters the market.  Now tomorrow is a Friday so I doubt we'll get a lot of volume then, so the market may float higher to fill the gap at 1320 which I mention in the below paragraph.  But be aware of any news data that may hit the wires tonight and early tomorrow morning.  Despite it being a Friday, this market is poised to fall hard once volume re-enters the market and a big news event will probably bring that volume in whether it's Friday or not.  Coming below 1284.05 would instill great confidence that a top is in, and/or big volume with a sharp move lower would do so as well.  But until then, I'm waiting on the sidelines.


The bulls are making a strong charge to push the market higher with a convincing day to the upside so far today.  There's an open gap at 1320 the S&P MAY work its way toward closing before topping.  The current wave is a ((c)) of Y of (Y) which would explain the strength today since C waves are similar to 3rd waves in strength.  With no signs of a top and reversal, I don't want to get in this market's way right now.  But I'll keep my eye open for reversal signs near that gap level at 1320 and/or a big reversal sometime today as well.

Learn Elliott Wave Principle


The euro surged higher with stocks this morning, failing to complete a clear impulsive decline.  Yet the british pound has completed an impulsive decline vs the USD.  So it's possible the pound has topped and reversed while the euro needs to make one more small high before topping.  I'm short the euro right now but the british pound looks good getting short if we get a big bounce from this 5 wave decline soon.  Either way, I'm looking to get long the USD (short the GBP or EUR) when opportunity arises.

PLEASE NOTE: THIS IS JUST AN ANALYSIS BLOG AND IN NO WAY GUARANTEES OR IMPLIES ANY PROFIT OR GAIN. THE DATA HERE IS MERELY AN EXPRESSED OPINION. TRADE AT YOUR OWN RISK.

Wednesday, March 23, 2011

Stocks and Euro Poised to Fall Sharply Soon


Internals today tell us that something bearish is just over the horizon. As this rally has progressed the past several days, volume has gradually decreased, suggesting a lack of enthusiasm and confidence in the move higher. Recall that the selloffs over the past couple months have been accompanied with volume well above 1 billion NYSE shares, usually around 1.15-1.20 billion. Today had a weak 877 million shares traded with advancers vs decliners and up vs down volume also suggesting a weakened move higher. The internals shown during this recent rally, and what we see today, suggest that this market is about to reverse sharply to the downside.

Don't get caught running with the herd – learn to think independently by downloading the Independent Investor eBook FREE!


This chart shows that the S&P’s momentum never really got off the ground. Not only are the waves clearly overlapping, the typical characteristics of a correction according to EWP, but the original 30 point rally from the bottom is the best it could muster up. The rallies haven’t even been close to that 30 point rise, and when you factor in that volume has also decreased steadily during this rally off of the 1249.05 low. It’s clear the market wants to move lower and that the recent uptrend is just a correction. A break below 1284.05 would break the trend of higher lows and give us a good signal that a top is in and that we should favor the downside when trading.

Learn Elliott Wave Principle


Above is an aggressive bearish count suggesting Primary wave ((2)) has topped and that an impulsive decline is developing. The reason I’m not in love with this count is because it doesn’t adhere to the EWP guideline of the “right look” in regards to proportionality. Notice that Minute waves ((i)) and ((ii)) are smaller than Minuette waves (i) and (ii). Having waves at a smaller degree bigger than the same waves at one larger degree is not typical in an EWP pattern. It violates no EWP rules, so it remains valid, but it does violate a major guideline in my view so I’m cautious in getting too attached to this count. An extremely sharp move lower would strengthen the odds of this count being correct since it would fit in well with a Minuette wave (iii) wave getting underway as the count suggests.


This count makes more sense to me. It explains the lack of proportionality I mentioned above, as well as the imperfect nature of the decline relative to an impulsive structure. But even though this is a corrective structure, it also shows a sharp move lower coming soon. So either way you slice it, the internals and both top wave counts suggest a top and reversal to a new low are coming soon.


The euro has failed to make a new high as I thought it would. The US dollar did make a new low though so I took that as a new extreme for the EUR/USD pair in general, but instead there is a divergence in place between the USD and the euro which has significant bearish implications for the euro and bullish implications for the USD. Today the euro is breaking down a bit, and with that USD divergence in place, it could be the start of something big. Also note that the stochastics on the weekly chart are overbought and crossing down. So this pair may be gearing up for a major sustained decline. If so, I want to be on board this train to funky town. In other words, I want to be short this pair, like right now, with a stop at 1.4255.


PLEASE NOTE: THIS IS JUST AN ANALYSIS BLOG AND IN NO WAY GUARANTEES OR IMPLIES ANY PROFIT OR GAIN. THE DATA HERE IS MERELY AN EXPRESSED OPINION. TRADE AT YOUR OWN RISK.

Monday, March 21, 2011

What are Stocks Doing? Euro to Break 1.4281 Anytime Now


I just wanted to add the internal data to today's market.  You can see that the bulls had pretty good control of momentum, but far from stellar.  Volume was just shy of the 1 billion share market on the NYSE.  And if you remember, or look at my internals postings the past couple weeks, the bears got volume well above 1 billion shares during selloffs.  So volume lightens up on rallies and increases on declines, a bearish behavior.  Advancers vs decliners was strong today but up volume was only about 74% of total volume, so again not a stellar performance from the bulls on today's big surge. 

Although I'm not convinced yet this is an impulsive move lower, it's still quite possible that this is at least a WXY correction lower with wave X completing now, and wave Y down will be getting underway shortly to below 1200 on the S&P.


The S&P broke the proposed wave ((i)) at 1294.26 this morning, making it less likely that an impulsive wave down is forming.  It's possible a series of 1s and 2s are unfolding, but I usually don't put money on that since it's usually just an excuse wavers use to label a correction as an impulse.  But as long as 1332.28 stays intact, it remains possible it's just a series of 1 and 2 waves unfolding.  So I'll watch it, but won't trade on it quite yet.

Elliott Wave International's Commodity Freeweek!


What do I mean by a series of 1 and 2 waves?  Glad you asked.  Above is a chart illustrating what I mean.  You'll see that there is a 1 and 2 wave at Minute degree labeled ((i)) and ((ii)), and another set of 1 and 2 waves at Minuette degree labeled (i) and (ii).  As long as 1332.28 remains intact then this count remains in play.

Learn Elliott Wave Principle


With 1294.26 broken, and then taking the above chart at just face value it looks clearly like an ABC 3 wave correction.  I do think this is probably what's taking place now however I'm not convinced the correction is over.  If anything I think we're in an X wave rally and then another ABC decline will ensue taking the S&P below 1200.

To be honest, of both these counts, I'm really not sure which is correct.  So I'm neutral here, waiting for more evidence of the medium term trend.


The euro's decline from 1.4281 never looked impulsive to me so I didn't label it as such.  In the short term I saw some 5 wave moves so I focused on those only.  I know a lot of wavers were labeling this as a 5 wave decline somehow, and perhaps it was because some of the other majors had cleare structures, but to me that's like shoving a round peg in a square hole.  Sure you can cram it in there with enough force and cleverness, but it doesn't really belong there.  Looks like I was right in that respect, but I was wrong in trying to short based on short term moves.  At this point it's quite clear the euro is still correcting higher on the long term count, and a break above 1.4281 should be coming real soon.  From there, we can then look for another real top and reversal.

PLEASE NOTE: THIS IS JUST AN ANALYSIS BLOG AND IN NO WAY GUARANTEES OR IMPLIES ANY PROFIT OR GAIN. THE DATA HERE IS MERELY AN EXPRESSED OPINION. TRADE AT YOUR OWN RISK.

Thursday, March 17, 2011

Stock Rally Looks Corrective, Downtrend Still Intact; Euro Finishing Triangle


Looking at the internals of today’s action it helps me answer the question I had all day: was today’s rally a correction within a larger downtrend, or did a bottom just get put in and a rally to new highs on the year coming? Looking at the internals it’s clear that today’s action fits much more with a correction than a bottom and reversal. Today’s volume was 1.04 billion NYSE shares compared to yesterday’s down day volume of 1.13 billion shares, and Tuesday’s 1.28 billion shares suggesting much less enthusiasm to the upside than downside. Also, today only had 1,392 more advancers than decliners on the NYSE and 316 more on the S&P, which are much less numbers than we’ve seen on down days the past few weeks. So these are not stellar numbers for such a big rally after a downtrend that’s lasted several weeks. Also note that the Nasdaq Composite closed with only about half of the percentage gains as the S&P and Dow indices. I know Japan is playing a big role in tech’s lagging here, but just looking at this from a technical analysis standpoint, the technology sector’s lagging is often viewed as bearish since higher risk stocks often lead the overall market (note that the Nasdaq 100 which is all technology stocks fared a little better than the Composite at 1.01% gains today).


So looking at these internals now, today’s rally is probably just a correction, and that a resumption of the downtrend to new lows is imminent. Of course, that may change with robust internals tomorrow or later on, but as it stands right now the larger downtrend is still well intact. The bulls took down no key levels, nor did it break the downtrend in price action, and the internals today were far from stellar.


Get Bob Prechter's Latest Elliott Wave Theorist Letter Free!


The S&P chart above shows that despite the big rally today, the series of lower highs and lower lows remains intact on even the 30min chart. It’s a good sign for the bears, but not a requirement for success. As long as the Minute wave ((i)) low of 1294.25 remains intact then I’m firmly bearish stocks.

Elliott Wave International's Commodity Freeweek!


On a minor note, I wanted to point out that the Nasdaq Composite (and NDX) did not participate in the late day rally that the S&P and Dow embarked on. You can see that it remained quite flat while the S&P surged higher on the above chart. Now I know the Japan crisis is leaning harder on tech stocks than others, but taking this at face value it MAY be a very subtle signal that more selling pressure is coming sooner than we think. We’ll see tomorrow if this little divergence turns into something much bigger.


The euro has continued its rally, as well as kicking me in the pants, as I was stopped out again last night on my short trade. I see no signs of a top right now so I’m neutral in the short term. It appears a triangle might be forming now as part of a 4th wave. So a sharp thrust higher to a new high and then reversal would then be in order in the Asian and European sessions tonight. Doing so might signal a longer term top and reversal, so I’ll be watching the action closely tomorrow morning to try and attempt another short position. Since I’m long term bearish the euro, I’m only looking for shorting opportunities right now.


PLEASE NOTE: THIS IS JUST AN ANALYSIS BLOG AND IN NO WAY GUARANTEES OR IMPLIES ANY PROFIT OR GAIN. THE DATA HERE IS MERELY AN EXPRESSED OPINION. TRADE AT YOUR OWN RISK.

Wednesday, March 16, 2011

Stocks Continue to Trend Down, no End in Sight Yet; Euro Poised for Big Decline


Internals continued to deteriorate today in favor of the bears. NYSE advancers vs. decliners was bearish, but not that impressive. But the 431 S&P stocks trading down today was impressive, and 88.5% of NYSE total volume trading to the downside was also impressive. Total volume was solid today coming in at approximately 1.13 billion shares on the NYSE, although not jaw dropping, it’s certainly stronger than what we’ve been seeing on the normal bullish moves higher the past several months. So the bears continue to roar, and with the series of lower highs and lower lows still intact, the downtrend remains well intact.

EWI's FreeWeek is Here! Get full FREE access to Elliott Wave International's most popular commodity forecasting service


The magnitude of this 3rd wave has called for me to adjust the degrees of trend I’ve been labeling as the 1st and 2nd waves. Now I have a more appropriate Minute waves ((i)) and ((ii)) down from the February high. At this point, we have enough selling and profits on the short side to just take a step back and focus on the bigger picture here in my view. So I’m not interested in counting every little sub-wave within this wave count at the moment. The important key to take home from this is that a 3rd wave is underway, internals are supportive of momentum still on the bears’ side, and the series of lower highs and lower lows remains intact. So the trend is firmly down and the short side is still the path of least resistance.

Support doesn’t really begin until 1225, but this market should move close to the 1170-1185 area before even thinking about forming any significant bottom. The area of the prior 4th wave tends to be a good area to find good reversal points. That area is still a ways away.

Learn Elliott Wave Principle


Above is a close up of the price action and wave count. I’m merely showing this because as it stands now, this chart looks extremely bearish and suggests a large almost straight line down move could be coming at any time. This rolling-over structure is often what precedes major sell offs. So be ready.


The euro’s 1 hour chart appears to have signaled a reversal so far. Amazingly, despite two new major swing highs at this very deep Minute wave ((ii)) retracement, it still has not exceeded the high put in earlier this month. Now we currently have a double top formation, and lots of selling pressure capping the market’s rallies at the moment as you can see from this afternoon’s big spike and reversal. Also notice that the RSI is lagging badly, diverging from the last few highs that price has made.

The evidence is strong that the euro is at the forefront of a major decline here. I’m short again the euro and will stop out if a new high on the month is made.


PLEASE NOTE: THIS IS JUST AN ANALYSIS BLOG AND IN NO WAY GUARANTEES OR IMPLIES ANY PROFIT OR GAIN. THE DATA HERE IS MERELY AN EXPRESSED OPINION. TRADE AT YOUR OWN RISK.

StatCounter