There are several indicators I look at every day to try and understand the health of the market. I don't talk about all of them every day because then I'd spend all day making charts and writing. We saw that yesterday's chart showing contracting advancers/decliners on the NYSE while price was rising was a good indicator that the rally was waning and a sell off was coming (see "CRAZY MARKET" post below). That sell off finally happened today around noon PST.
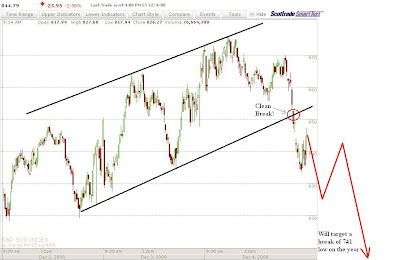
Above is another chart that I was watching because of the channel that formed for the rally this week. You can see a nice parallel ascending trend channel shown with the black lines. I basically decided that whichever way the market brokeout to, was the way the market would strongly take us in the near term. As you can see on the chart above, the market broke cleanly and strongly to the downside which tells us that the market's near term trend is down, and much lower levels are soon to come. Usually when a market breaks a trendline it will rally up to touch the underside of the trendline and then reverse downward again. So it's possible we'll see a rally overnight in the futures, or early in tomorrow's session and then a very very sharp reversal to the downside. As long as the market doesn't break through the underside of the trendline and trade back inside the trend channel again, the short term trend is down. And it should move in a hurry.
I'm holding short, with no long positions. If my analysis is right, tomorrow and next week should be heavy selling taking us to new lows on the year (S&P below 741).
No comments:
Post a Comment