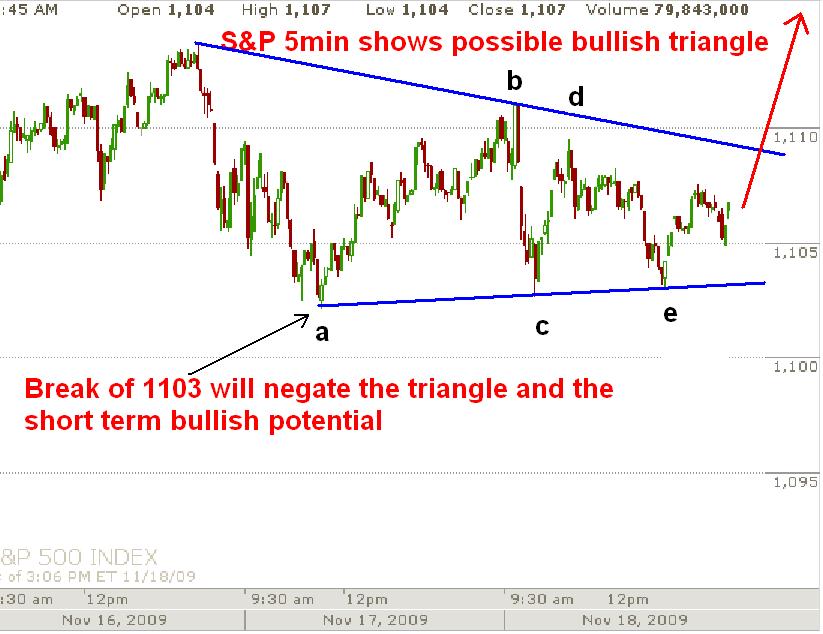
Just a quick heads up. The sideways consolidating action in the S&P looks like a triangle which occurs in the 4th, B and X waves. This would most likely be a 4th wave triangle which will be followed by a 5th wave "thrust" to new highs. Thrusts are terminal moves are quickly reversed. A break of the wave "a" low at 1103 would negate the triangle and the short term bullish potential. So hypothetically if I were to do a short term short position, I put a sell stop below 1103 just in case the triangle scenario unfolds. Or if I wanted to get long I might go long now with a stop just below 1103. But I'm still short term neutral myself, until the market gives evidence that a top is in, at any degree.
PLEASE NOTE: THIS IS JUST AN ANALYSIS BLOG AND IN NO WAY GUARANTEES OR IMPLIES ANY PROFIT OR GAIN. THE DATA HERE IS MERELY AN EXPRESSED OPINION. TRADE AT YOUR OWN RISK.
2 comments:
http://stockcharts.com/def/servlet/Favorites.CServlet?obj=ID3287600&cmd=show[s177176366]&disp=P
Check out the Bollinger bands, they really show how wound up the SPX is, just waiting to break!!
Thanks Michael. It looks like a breakout for sure. It can make a great trade if someone were to put a buy stop just above the daily high and a sell stop at the wave a low, playing for the breakout.
Thanks for chart/link!
Todd
Post a Comment