RSI Study

The RSI is a very basic and simple momentum indicator. But I've found that of all the momentum indicators I use, the RSI is the most reliable, especially on the 1hr and above timeframes. Above is a chart of the S&P cash index hourly chart showing two instances in the past where price continued with a new high(s) and yet the RSI did not confirm those new highs. This divergence resulted in modest declines in both cases. You can see that this scenario is now occurring on a much more elongated scale where price has worked higher while the RSI has lagged drastically. My experience with this type of action suggests that when the market does top and reverse, it will be very very sharp. But this is not a timing indicator. If I get short too early, the market can continue higher and snap back down hard, but only get me back to my entry point. I don't take trades to try and break even, so I think the best strategy is to wait for signs of a top and reversal to then get on board and enjoy the ride lower.
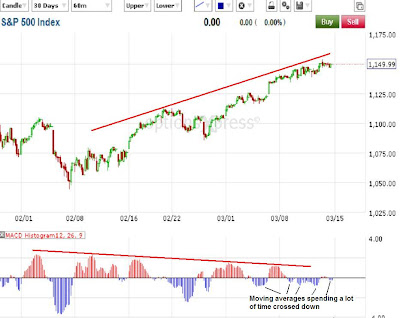
MACD Histogram Study

Above is another common and simple momentum indicator, the MACD histogram. Again I'm showing an hourly S&P chart which also shows a bearish divergence occurring as well. This chart supplements the RSI divergence above, because the MACD histogram at the bottom shows that the moving averages have steadily gotten tighter and tighter on this rally, and have recently spent a lot of time crossed down, despite the market's price grinding higher. Again, this extreme overbought exhausted rally condition usually will result in a sharp snap back decline. But when? This does not tell us anything about the timing, just that the rally has become quite extended and that the upcoming decline should be sharp.
So there it is, more evidence of an overbought extended rally. But without confirmation of a top and reversal, we have to allow the market more room to push higher.
PLEASE NOTE: THIS IS JUST AN ANALYSIS BLOG AND IN NO WAY GUARANTEES OR IMPLIES ANY PROFIT OR GAIN. THE DATA HERE IS MERELY AN EXPRESSED OPINION. TRADE AT YOUR OWN RISK.
5 comments:
Todd
Check out this web site.
http://consumermetricsinstitute.com/index.html
Fantastic real time data on economy. Their primary comprehensive market leading indicator has crashed. Worth reading if you want fundmental support for a technical outlook. In short, a double dip recession scare if not in fact is coming and that probably means a weaker stock market.
Todd
The front page chart alone of this real time econ data web site will support P3. The rest of the site is fantastic too.
http://consumermetricsinstitute.com/index.html
JD in FL
Yeah, thanks JD. That's certainly not a pretty picture.
Todd
Hello People:
Really I don't understand the chart in the site posted here, but the fundamental picture is very bad from a big time to this part and it is not correlated with the direction of the market.
Only today I feel the possibility of go down definitely.
Regards.
Hi Gustavo,
The charts are just momentum studies showing that momentum has severely weakened in the latter stages of this rally.
And I agree, I don't see any fundamental support for the rally. But maybe the big shots know something I don't. The economy is flat and faltering, yet the market floats higher. But the market is always right, so what can you do, lol?
Todd
Post a Comment