
So the 4th wave triangle played out with a sharp thrust lower this morning that held into the close. Although it seemed to track well with one of the counts I had yesterday, the fact that the thrust did not reverse upward toward the apex of that triangle is a bit odd. It also lessons the likelihood of the count above being accurate. It's possible the formation I labeled a wave 'iv.' triangle was just a series of 1s and 2s instead. If the market doesn't rally strong tomorrow to take back today's losses and reverse the thrust, then I'll have to relabel the above wave count to somehow fit in a series of 1 and 2 waves in place of the triangle. That would complicate the short term count considerably. So I'm posting this count above tentatively since it's the best one I have right now. Once the market plays out a bit more in the coming days, I should be able to have more confidence in my current count. But regardless of the little nuances of the short term structure, the market action and technicals do suggest the larger trend still remains down. I expect lower levels to be acheived over the coming days/weeks.
MARKET INTERNALS

Today was a bloodbath internally for the market. As you can see, the numbers were extremely bad; so much so that it is not really conducive of a 5th wave thrust that the triangle count I posted yesterday would suggest. A 5th wave should be composed of diverging internal strength and momentum compared to the previous wave 3, however these internals show that it's more parrallel to the previous wave 3 than anything else. So again, my wave count at the top is in question. 89.7% of NYSE stocks closed down on the day, 98.2% of all volume on the NYSE was to the downside, and only 2 stocks in the S&P closed up today. So the bears ruled the day big time today.
INDICES AND SECTORS

Above is a list of the major indices and sectors' closing numbers. I noticed a pattern here of rotation out of higher risk assets and either put into a form of cash as yields suggest, and some into lower risk assets. Notice that the high risk indices like the small caps and technology traded down the biggest, while the safer indices, like the Dow, had less damage done. Also notice that the more speculative sectors like financials and consumer discretionary were down big while safer sectors like utilities and health care were far less damaged. So this wasn't a fluke today. Above average volume came in today and sold everything, and removed risk off the table.
And lastly, we got a nice spike volume as well on this decline which is one of things I wanted to see if in fact we are in a wave 3 of [3] or C. Today's NYSE volume exceeded the 13 day moving average convincingly, and kept the trend alive where rallies are done on lessening volume while declines are done on increasing volume.
So all-in-all, quite a bloodbath today for the bulls.
SHELVES
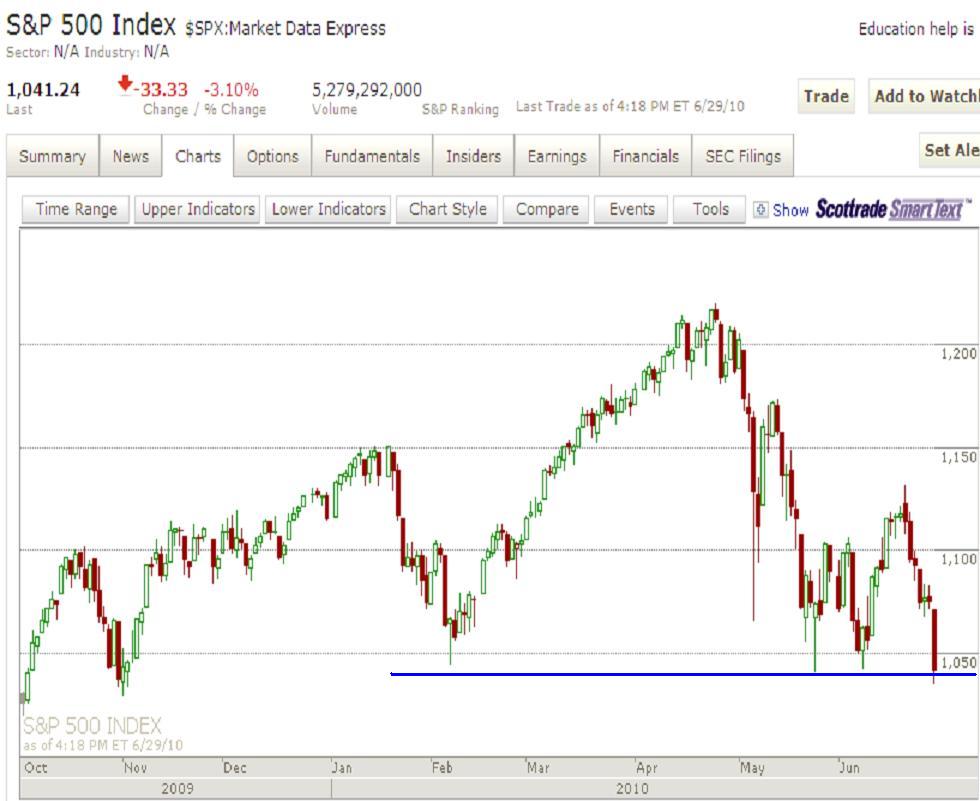
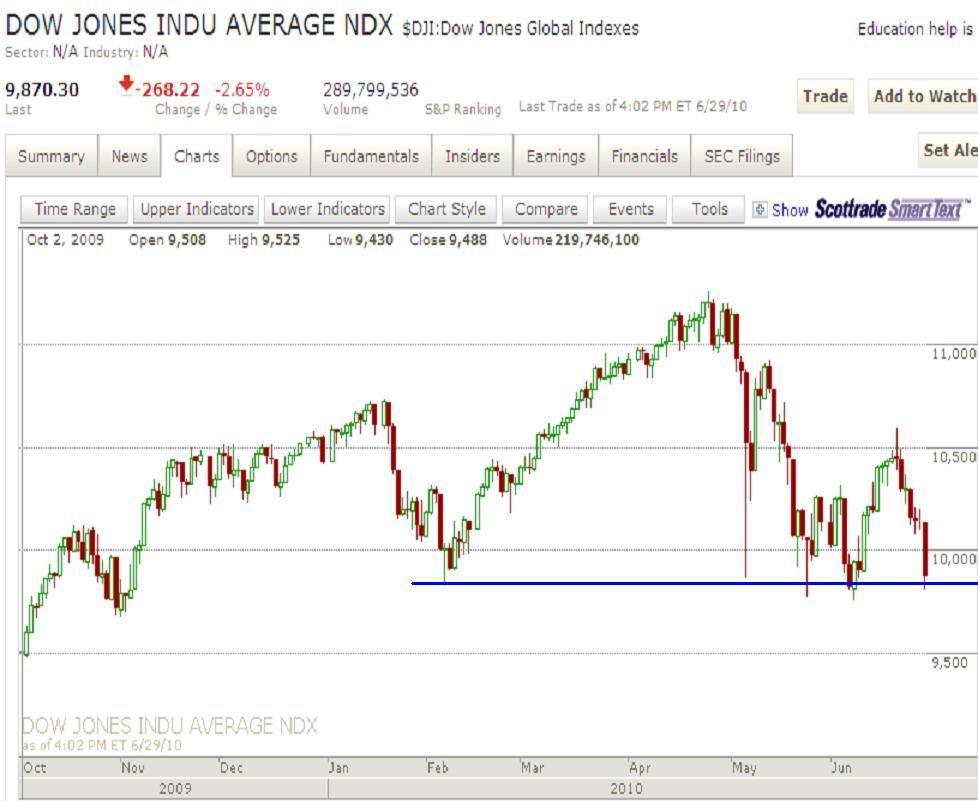


Today we again flirted with the important support shelves that have been holding this market up for the past few months. We started to break down below these levels near the end of trading today but a sharp rally into the final minutes brought them all to close just about right on their shelves. There have been so many attempts to take out this support that it appears these shelves will be taken out in just a matter of time since each attempt to do so erodes the barrier more and more.
If we are in a wave 3 of [3] or C, I'd like to now see continued price destruction conducive to such a move. Especially now that perhaps we're getting good volume numbers back into the declines. In my humble opinion, the best case scenario for us elliott waver bears is for the market to just blast through these support shelves with another big down day tomorrow that closes on or near the lows of the day. Although the market may appear oversold at that point, it would mean that the wave 3 of [3] count is probably correct, and then the oversold condition everyone sees would be irrelevant as wave 3 at various degrees can remain in extremes for a very long time. So let's see that follow through blast through support tomorrow and finally destroy the bulls will in the short term finally.
PLEASE NOTE: THIS IS JUST AN ANALYSIS BLOG AND IN NO WAY GUARANTEES OR IMPLIES ANY PROFIT OR GAIN. THE DATA HERE IS MERELY AN EXPRESSED OPINION. TRADE AT YOUR OWN RISK.
1 comment:
Hi,
On 6/22/2010 SPX sketched a similar pattern (looked like a triangle, and led me to wonder whether it was a B wave, and whether the whole move on 6/22 was an ABC). It turned out to be a wave 4 of 1 of 3. Yesterday's ABC looked similar. FWIW, here is my chart.
http://www.screencast.com/t/ODQ4NDdjMTgt
In case the world is prone to magic and today's low were to turn out to be wave 5 of 1 of 3 (instead of 1 of 3), then one thing to note is that 3 of 1 of 3 was 1.62 times 1 of 1 of 3.
Thanks.
Post a Comment