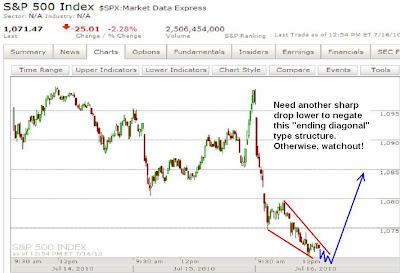
I need to come up with a name for this structure since I've seen it so many times. It's a sharp drop followed by a little or no rally, then just a choppy grind lower. This usually leads to a very sharp rally and eventually to new highs. It's a corrective structure. Although this outlook will be negated if we instead get a sharp drop lower again. But as long as that choppy grinding mess lower exists, beware of a sharp snap back rally.
PLEASE NOTE: THIS IS JUST AN ANALYSIS BLOG AND IN NO WAY GUARANTEES OR IMPLIES ANY PROFIT OR GAIN. THE DATA HERE IS MERELY AN EXPRESSED OPINION. TRADE AT YOUR OWN RISK.
6 comments:
without me this figure !
Wolfe wave
The initial drop on this chart looks like an minuet impulse wave-i, down. This is followed by a sub-minuet wave-a, rise, and a standard sub-minuet wave-b decline. The form of this corrective structure is termed an "Elliott Irregular Correction", in which the wave-b travels beyond the terminus of wave-a. This is well-described in the Elliott text. The purpose of the wave-b is to get everyone excessively bearish, and it would likely be followed by a sub-minuet wave-c rise, that would exceed the level of the start of wave-a.
Thanks for the post. I can see it as a flat, especially since the wave C is a 5 wave rise, although not impulsive since the waves overlap. Then the sharp decline seen Friday fits well as a 3rd wave. So the count is on track. But I want to be as objective as possible when viewing wave structure and market structure so it keeps me honest. I think the behavior and likelihood of wave (iii) of 3 down being underway right now is high, but I wouldn't go "all in" with what I see right here so far.
Thanks again for the insight.
Todd
I like it!
Here's my problem with ending diagnols: where do you draw the top trendline? Why start drawing it there? What about all the other top points that preceded the most recent one? I usually see these diagnols actually fail more than half the time. What happens is price breaks higher, traders cover shorts thinking it's an "ending diagnol" and then price actually declines further from another, flatter declining trendline like a parallel channel line formed parallel of the lower one. How do you determine that this is an ending diagnol. IMO the only true legitimate ending diagnol is one with 3 trendline touches on the upper trendline. I actually never consider two connected points a valid trendline, you really should have at least three, though that often doesn't happen, which is why trading is so difficult.
Post a Comment