I just wanted to add some currency data to today's post I put up a few minutes ago. The euro (EUR/USD) looks poised for a top at some degree. Since I feel the larger trend is firmly down, any topping structure in the short term gets my full attention since it could lead to a major selling phase for months.
Above you can see that a possible ABC correction is unfolding with the tail end of wave C wrapping up here soon. The RSI is diverging in the 5th wave which is a typical development. Also, wave C is counting well as a complete, or soon to be complete, 5 wave move. We even have a triangle completing yesterday and that fits well with the sharp rally today as a thrust from that triangle. Although there's no significant decline yet to place risk at a top with high confidence, I thought I'd point this out since some aggressive currency traders might find use in it. I'm one of them as a matter of fact and went short at 1.2882 with a stop at 1.2945. A break above 1.2945 certainly does not negate this corrective topping structure, it just means it's extending. And I need to control risk and I think 1.2945 is where I'd want to step aside and wait for another good sign to short.

Also notice that the USD/JPY, a currency pair that often follows the stock market fairly well. Although I know other pairs now do so much better, like the AUD/JPY. But still it tends to move more-or-less in line with equities. Well here on the hourly chart you can see it is clearly not doing so and recently it did a big pop rally that was completely reversed almost immediately. This is very bearish in my view, and trading below 84.00 would be a good sign that this pair is heading quite a bit lower.

Lastly, the last post was already quite long and I didn't mention this to prevent crowding. But I thought I'd add it here to this addendum post.
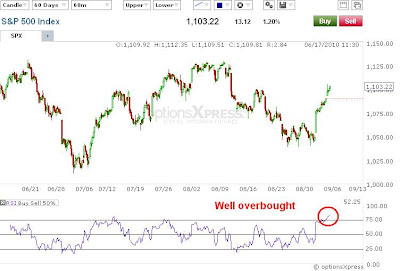
Almost all the major indices and the XLF are sporting a similar overbought indication on the RSI hourly and 2 hour charts. This is not a good timing indicator, but it sure illustrates what I said earlier about the market moving too much too fast. Here you see that the S&P's RSI is deeply overbought and is at a much higher level than where it was at during the August 9th high, yet the S&P is still almost 30 points lower. If the stock market wanted to undergo a major selloff, shooting momentum indicators to this extreme right before doing so would certainly be a high probability. This doesn't mean a major decline is coming, but if a major decline is in fact coming, then this would certainly be what you'd want to see prior to it occuring.
Have a good long weekend everyone!
PLEASE NOTE: THIS IS JUST AN ANALYSIS BLOG AND IN NO WAY GUARANTEES OR IMPLIES ANY PROFIT OR GAIN. THE DATA HERE IS MERELY AN EXPRESSED OPINION. TRADE AT YOUR OWN RISK.
No comments:
Post a Comment