
Market internals today were solidly bullish and if anything I'd expect to have seen modestly higher prices than what we closed out with such strong underpinnings here as the bulls were fully in control today. Also notice another uptick in volume today to the 1 billion share mark again. This is still low volume for the market overall, but relative to the past several weeks this is the upper end of the volume range we've seen. I think this is merely fund managers josseling around positions in preparation for the end of the 3rd quarter. So we might see some more upticks in volume the rest of the week and slightly higher levels as folks are going to try and keep the markets higher to close out a positive quarter on their books. What happens the first and second weeks of October will be very telling then.
The Dow and S&P eeked out new highs from yesterday which negate the bearish count I posted this morning. The alternate count for an (A)(B)(C) correction for wave ((2)) is still in play since the new highs today could just be wave (B) of a flat correction. This would mean a sharp shot to beneath today's low probably sometime tomorrow to complete wave ((2)), then rallying ferociously higher in a wave ((3)). But since wave (A) looks like a clear 5 wave drop, I doubt that this count will turn into a flat correction since wave A's in flat corrections are 3 wave affairs, not fives (Elliott Wave Tutorial, 4.1). So I'm not posting the count again this afternoon. For reference to this count, please see the prior post.
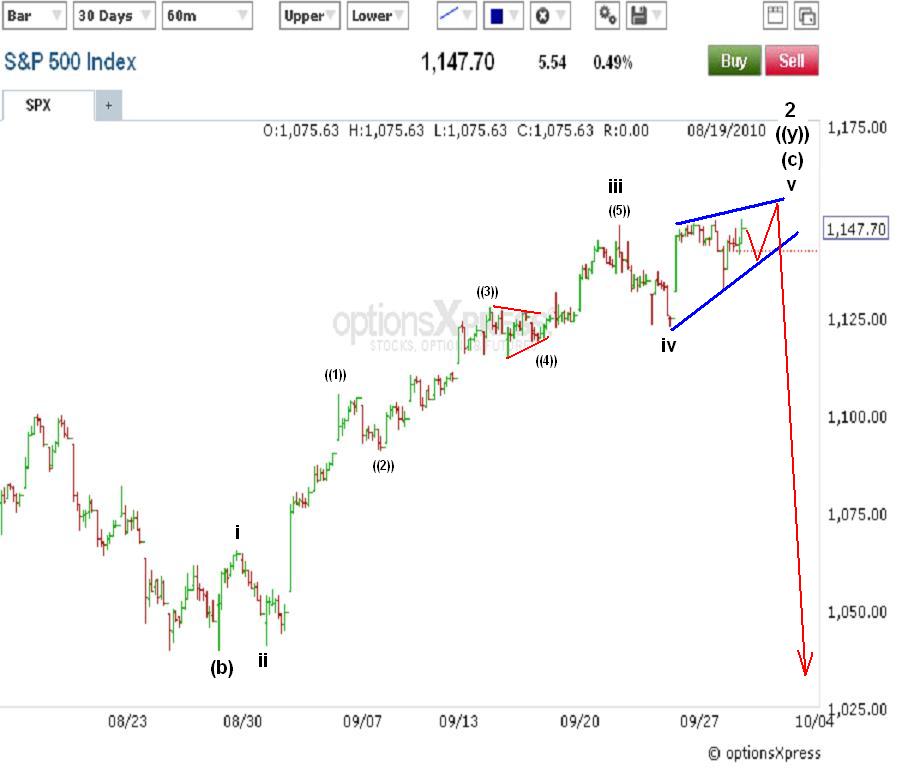
So moving onto the count I have above. I'm thinking we might be entering an ending diagonal for several reasons:
1) momentum divergences on the 4hr and below charts are starting to really become quite elongated.
2) the Nasdaqs did not make new highs today with the Dow and S&P, and have lagged mildly the past few days suggesting a little risk is coming off the table.
3) the VIX continues to move higher with the stock market's new highs, which is not typical, and suggests some folks are not fully believing in the latter part of this rally.
4) "An ending diagonal is a special type of wave that occurs primarily in the fifth wave position at times when the preceding move has gone 'too far too fast', as Elliott put it, " (Elliott Wave Tutorial, 3.1). So the wave count sets up nice for an ending diagonal here for a fifth and final wave after a very extended wave iii.
5) the choppy movement with 3 up and 3 down lately also fit nicely into an ending diagonal pattern starting.
If we are fortunate enough to in fact get an ending diagonal formation to occur this week, it would be an outstanding opportunity for the bears. Ending diagonals are clear signs of a weakening and ending trend that result in sharp and often deep reversals. So let's watch for this.


My euro elliott wave count I posted a couple days ago is still in play. I also wanted to draw attention to the daily chart which shows the RSI is at levels that have either corresponded with , or near, major highs in the past. It's in the fibonacci reversal zone common for reversals right now, so a top can occur any time now. But unfortunately I see no signs of that happening at the moment so we simply have to wait. Once I do get signs of a reversal, I'll mention it here because a euro collapsing in a wave 3 will certainly put some pressure on equities as well.
Some of you have joined in on the discussions in my new Elliott Wave Forum, and I thank you for that. I hope you will continue to share your thoughts and anaylis with us, and I encourage you all to do the same.
I've also been having a good discussion with Scott regarding Bob Prechter and Elliott Wave Theory as a whole over the past few days and I welcome you all to chime into the discussion through the Elliott Wave Forum where I'll post some of his comments, or through the comments section of the original post that started the discussion.
RECENT ARTICLE:
Also, check out the most recent Elliott Wave article Deflation: The Trend That's Become Too Obvious To Ignore.
PLEASE NOTE: THIS IS JUST AN ANALYSIS BLOG AND IN NO WAY GUARANTEES OR IMPLIES ANY PROFIT OR GAIN. THE DATA HERE IS MERELY AN EXPRESSED OPINION. TRADE AT YOUR OWN RISK.
2 comments:
I came up with a similar chart by coincidence http://www.screencast.com/t/NzgxYmM2NmMt .
The only concern I have an ED is that we just had a ED-like pattern in August, and was thinking maybe the market would like to "try" a different pattern on us this time around.
Yeah you're looking for alternation. Makes sense and we sure might get it. But also consider that after an extended 3rd wave, especially one that we've just had within wave v of (C), ending diagonals have the best chance of occurring. We should know soon enough if it will play out. I'd like an ending diagonal to play out because as you know, it would be a great trading opportunity with high confidence.
Post a Comment