
Internally the market was very bullish today in and of itself, however volume was very light and it did not match the bears’ intensity to the downside yesterday. Today the NYSE had 1,526 more advancers than decliners while yesterday had 1,608 more decliners than advancers. Today’s S&P advancers over decliners were about the same as yesterday’s so that’s a neutral result. Volume on the NYSE’s down-day yesterday was 1.03 billion shares while today’s up-day was only 987 million shares. Also, price today did not recover all losses from yesterday. So the bears held on to slight advantage by the skin of their teeth.
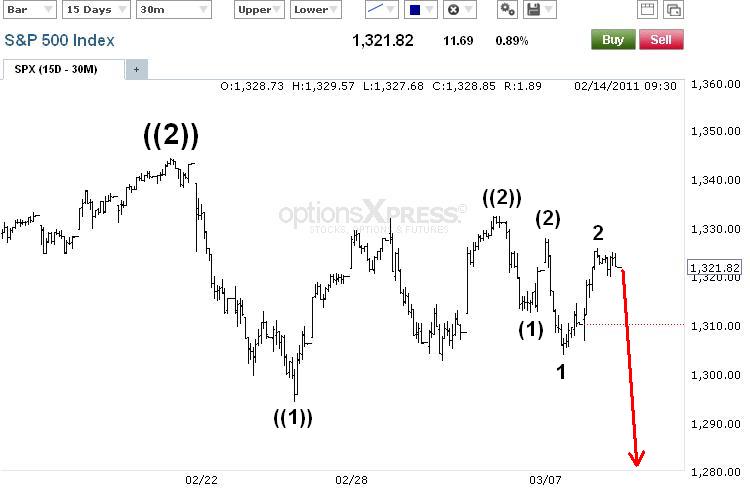
The aggressively bearish count above is not looking good from a probability standpoint. There are just too many wave 1s and 2s in place. From my experience, when I start counting a lot of 1 and 2 waves at various degrees it’s because I’m going against the trend, and trying to justify choppy price action with 1 and 2 waves. Although the above count is sound as far as EWP is concerned, it seems a bit unlikely. Only a very aggressive shot lower tomorrow, while not breaking above 1327.68 in the morning, would move this count up in probability.
Learn Elliott Wave Principle

The above count suggests a triangle is underway, and it would definitely explain the very choppy sideways nature of this market lately. Without breaking out to a new low or new high for about two weeks now, it makes this count more likely. A break below 1302.58 would put this count in severe jeopardy, while a break below 1294.34, or break above 1332.28, would completely eliminate it.
So to give you the bottom line, in order to take a position short term we need to know what the possibilities are, and I listed the top ones above. Staying within the levels I mentioned the triangle requires means that a very sharp shot higher to new highs on the year will be on the way once the triangle is completely. Of course, we’d like to get long with a stop just below 1302.58 or 1294.34 (depending on risk tolerance) in anticipation for the shot higher. However a break below 1302.58, and especially 1294.34, would eliminate the triangle and make the more aggressively bearish count more likely and therefore suggest a short position is preferred.
Big Advantages of Trading with the Wave Principle

The euro continued to fall last night as I would have wanted it to after taking a bit of a gamble on a short term short trade once I saw some subtle topping behavior yesterday. Even though we only have 3 waves down so far from the high, we only need one more new low to make the decline 5 waves. Doing so would be solid evidence that a top was in place and that we should favor the short side indefinitely. A break above 1.3956 before making a new low would cause some overlap and make this count invalid.
PLEASE NOTE: THIS IS JUST AN ANALYSIS BLOG AND IN NO WAY GUARANTEES OR IMPLIES ANY PROFIT OR GAIN. THE DATA HERE IS MERELY AN EXPRESSED OPINION. TRADE AT YOUR OWN RISK.
5 comments:
Bounce off the 1313 level. Breakout of the symmetrical to the upside coming
Looks like it. Should be extremely sharp.
WOW What a day! Market doesn't know what to do!
On page 33 of EWP it shows extensions . Could this be a possibility since the last twelve days looks like a triangle in the S&P and triangles only appear in 4th waves and B waves ?
Triangles also appear in X waves, but that looks unlikely here. An extended 5th is possible, and if this is a 4th wave triangle then that might be the case.
Post a Comment