
This chart illustrates why I haven't been posting much lately. Stocks have simply floated higher in a an unconvincing, yet very persistent, grind to higher levels. Just look at this chart and think to yourself how you would write a post based on this crap above unfolding. The lack of conviction and volume on the rally has left me skeptical of its ability to be sustained much further. But it has done so, seemingly on an empty gas tank. As I've said in past posts, this can continue even longer, and without evidence of a top I don't think it's wise to short here. I'm waiting for a reversal pattern to form, and hopefully it will be accompanied with solid volume, before I attempt shorting stocks. The divergence in price between the Dow's new high and the S&P's lack of a new high remains in place. So if a reversal pattern forms with that divergence still in place, it will leave a nice high probability shorting opportunity in my opinion.
Learn How to Apply Fibonacci Retracements to Your Trading

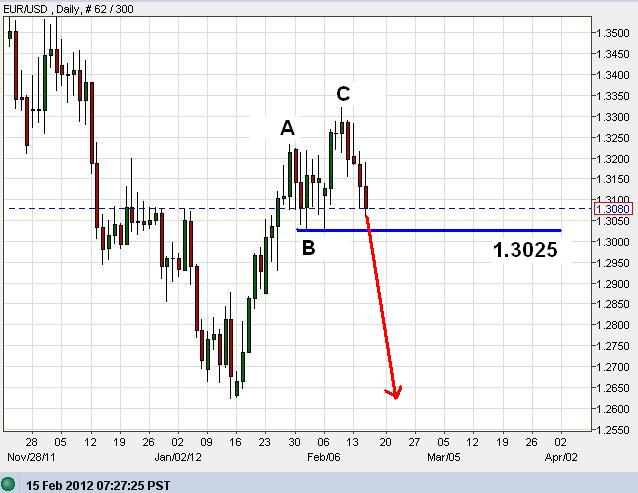
The euro has a couple options here: one is bullish, one is bearish. Which I am well aware is an absolutely useless statement at this moment in time. But let's look at the options to see how things will setup for a trade in the future. The bullish outlook has the move from 1.2625 to 1.3225 as an impulse move (probably an A wave) and the up-down movement since then can be a "flat correction" (probably a smaller degree ((a))((b))((c)) of B wave). This means that the current decline is simply wave ((c)) that will come down just below 1.3025 before bottoming and then undergoing a fierce rally to the upside. Okay, so that's the bullish view. The bearish view has the entire rally, from 1.2625 to 1.3325, a 3 wave correction that has completed. The result will be continued selling pressure for the foreseeable future which will take the euro well below the recent 1.2625 low. Right now, the euro is simply making a stair-step decline, with big looping moves to the downside, and therefore there is no impulsive pattern to help further analyze the bigger picture. However, the series of lower lows and lower highs means the current trend is down at the moment.
My approach is this; wait for a move below 1.3025 and see what happens. Continued selling pressure and closes beneath that level will reduce the likelihood of the bullish outlook since wave ((c)) of a flat correction shouldn't go too deep as an EWP guideline (not a rule though). Since trading is all about probabilities, I think the probability at that point would favor the bearish view and getting short at any opportunity. On the other hand, if the euro makes a quick dip to 1.3025 and then reverses sharply higher, I will jump on the long side since it would appear that the bullish flat correction might be unfolding and the move higher will probably be a sharp and deep impulsive move higher for wave C.
But unfortunately, at this point we are only left with concluding that the euro will either go up, or it will go down. A completely useless analysis at this point in time. However, by looking at our two options of wave patterns, we can sit and wait for more price action to unfold to work ourselves into a high probability trade.
Learn Elliott Wave Principle (EWP)
PLEASE NOTE: THIS IS JUST AN ANALYSIS BLOG AND IN NO WAY GUARANTEES OR IMPLIES ANY PROFIT OR GAIN. THE DATA HERE IS MERELY AN EXPRESSED OPINION. TRADE AT YOUR OWN RISK.
1 comment:
The upward march rolls on as the indices push to another round of new highs today. We continue to see the potential for extended gains in this advance, based on the persistence of this up move, the recent breakout above significant resistance levels, the need for higher prices for this up leg to become impulsive overall, and the precedent set by previous instances that sported similar internals. However, a test of our location within the pattern may very well be near.
After rallying a hefty 6% over the past nine sessions, the indices now sport a near-term up leg that appears to be nearing completion. If it is and price pulls back, it will provide notable clues regarding our exact location within the move off October’s lows. Specifically, we should get a much better idea regarding the early-March pullback, and whether it was a 4th wave or something smaller. And that will help determine the juice left in the overall up move.
What we know is that if this is the breakout it appears to be, significant work to the upside is still on the way as the move becomes a five-wave pattern. In the meantime, our goal must be to determine exactly where we are so that we can better understand where we’re going.
Post a Comment