
The market was poised for huge gains today as US futures were up big last night. Although by the time the US cash market opened this morning, the rally had fizzled and stocks were spiraling downard. Most likely it was up on speculation the Spain bailout would save the world. But that speculation was crushed, and reality set in with a big selloff most of the day today. The flip to the downside was big. Internals were firmly bullish at the open and then flipped to become extremely bearish by the close. But all-in-all, the important takeaway point here is volume. Despite the big reversal today, volume was very light with NYSE shares totaling only 739 million. This is probably a "b" wave down. That's all.
Listen: EWI's Chief Analyst Hochberg Explains Recent Action in Stocks, U.S. Dollar and More

The daily S&P cash chart shows an outside reversal that would suggest the larger downtrend has resumed, i.e. Minor wave 2 up is complete and wave 3 down is underway. But with volume so light, and the correction so fast as far as time is concerned, it is tough to have confidence that a top is in. I think this is a fakeout. The market may fall a little more short term, possibly even toward 1275, but ultimately it will probably bottom and rally sharply for wave ((c)). I don't like trading corrections, or putting too much weight into anticipating when they will end since there are so many variables in EWP on how a correction can unfold. Instead I like to look for basic technical signs of a reversal instead. Today's internals and price action got my attention, but the volume was just too light, the length of the correction just doesn't look right. So I'm holding off calling a top and resumption of the downtrend for now. Only a solid break of the Minor wave 1 low at 1266.74 with increasing volume would have me reconsider that.
Don't miss out on free trading tools. Elliott Wave International is extending their offer to get their 10 page monthly newsletter, The Financial Forecast, for free. They will offer it free until June 14th. Check it out here.
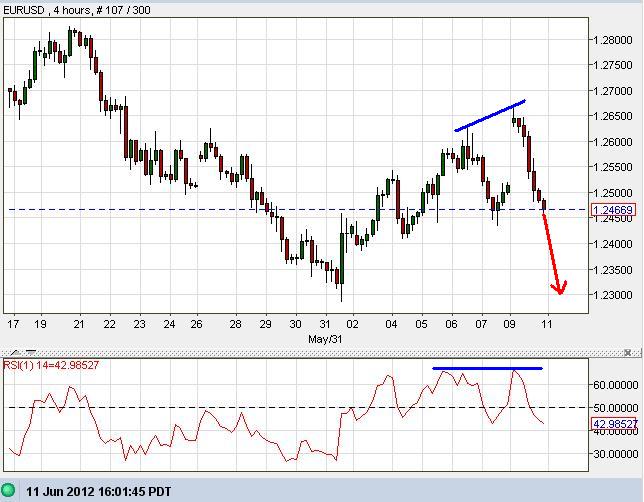
In last post I suggested a top was forming partly because the 4 hour RSI was diverging from price, and since a candlestick topping formation was unfolding. Unfortunately the EUR/USD popped higher big time Sunday night on a gap which stopped out my short position. Still having confidence in the bearish outlook though, I re-establish 50% of that short position in anticipation of the gap closing this week. I just didn't realize the gap would close this quickly. If it rallied higher I would have slowly added to the position. But I didn't get the chance. The EUR/USD appears to have topped now and is headed towards 1.2300 at a minimum.
Learn Elliott Wave Principle (EWP)
PLEASE NOTE: THIS IS JUST AN ANALYSIS BLOG AND IN NO WAY GUARANTEES OR IMPLIES ANY PROFIT OR GAIN. THE DATA HERE IS MERELY AN EXPRESSED OPINION. TRADE AT YOUR OWN RISK.
3 comments:
Very interesting labeling that move down wave (b), with a theory for wave (c) for one more push up. This seems to be the rationale for "sane" EW types, which almost none are as good as you. Your track record this year bears that opinion out. Good work as always, and we'll see if wave (c) plays out for the final curtain call on this corrective rally. Then I go short like a crew cut on a drill sergeant.
Thanks Vinnie! I'm only playing the probabilities though. The price bar yesterday definitely deserves attention and respect. But with such light volume it has me skeptical. We'll see, things change so quickly in these markets I want to see what today and tomorrow bring us.
Here we go again, everybody is happy, the world is saved, all the underlying problems in Europe and US have been "fixed" with the promise of stimulus. We just crossed DOW 12,850, a point where I as dangerous to be long. Why would the Fed inact any kind of stimulus with all indicies UP for the year? When they did QE1 and 2, markets were heavily sold off. This is not the case today. Is the Street so piggish, it demands stimulus for the purpose of making new highs rather than a backstop to a crisis? I'm looking for a triple digit selloff after Bernanke speaks on Wednesday. We are very overbought, and based on world economic problems, DOW 12,100 isn't outlandish to visit fairly soon. What does your EW model tell you?
Post a Comment