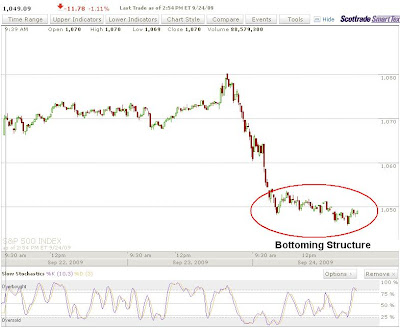
Attached above is the S&P cash 5 minute 3-day chart. it shows a very familiar structure I've seen in the past several selloffs. It's a bottoming structure. The sellers get exhausted and the market just floats around the bottom sideways until a swoon of bulls come in and launch the market to new highs. The EUR/USD, gold and especially silver, have all been extremely weak today, however they appear to be trying to find their footing now as I write this. The Nasdaq 100 did not make new lows as all the other indices did late this morning, and the Dow is not confirming slight new lows by the S&P. When you add all this up, it suggests a big snap back rally is about to occur. This can all be negated if the market turns lower and brings the Nasdaq 100 to new lows and solves the "bottoming-sideways action" we're seeing right now.
I'm still bearish, but caution is warranted with the current structure unless we shoot to new lows into the close.
No comments:
Post a Comment