
Please check out my post from right before today's close to help supplement this current post.
The internals today show similar weak volume as we've had over the past couple months, especially on rallies. When the decline starts, a strong breech above 1 billion shares on the NYSE is expected, and can help us confirm or refute whether a longer term bearish move is kicking off. Also of note is that despite indices closing flat or up today, the internals of the NYSE and S&P all closed negative. Again another sign of a severely exhausting rally.

The above Dow wave count is the same as yesterday's. (I'll switch to the S&P count as soon as the errors in all the momentum indicators from the bad tick clear up on my charting software). Notice today I'm posting the 2hr chart instead of the 1hr chart I posted yesterday. I did this to continue to illustrate how the momentum divergences are now working their way into the bigger timeframes since you can see that today's late turn down cause the RSI to turn down as well, creating a bearish divergence on this 2hr chart now. The rally is clearly weakening. Learn Elliott Wave Principle for free here.

Now I tend to get into trouble over-analyzing the small timeframe charts, so I don't have much confidence in this, but I just wanted to show this as something to at least watch for tomorrow morning's action. Notice that finally, the series of higher highs and higher lows was broken today as you can see on this Dow 5min chart. The Dow failed to make a new high late in the day and then actually fell to make a new low. This COULD be the start of a breaking of the uptrend. Although other indices have failed to follow suit and we do need to see it on the bigger timeframes to really get our attention. But since it happened into the close, I wanted to point it out in case we're flat or weak tomorrow morning. It may prove significant and allow people to position themselves accordingly.
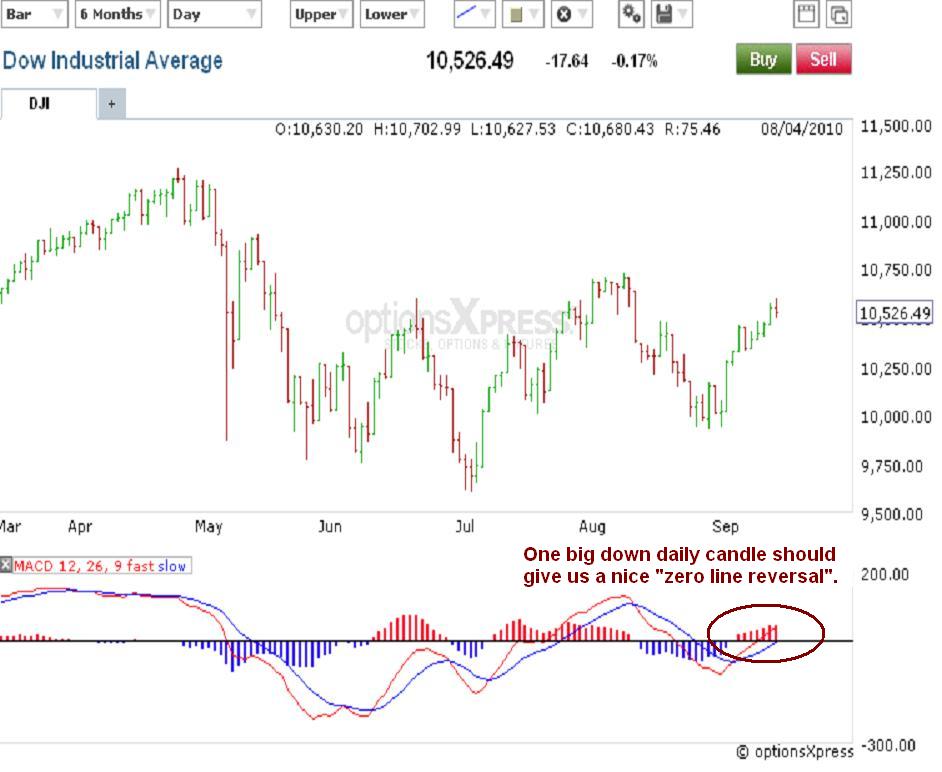
As I've been mentioning the past few posts, Elliott Wave International's Ultimate Technical Analysis Handbook discusses the the MACD "Zero Line Reversal" on page 12. Above is the daily chart of the Dow showing the moving averages right at the zero line area to where one big down daily close should cross the averages down and give us a nice setup for the this indicator. This would be very bearish for the market and could lead to a massive decline last several days if not weeks. Options expiration is Friday and it also surround the anniversary of the September 19, 2008 top which would be similar to the one we'd like to see happen here. So things are lining up well for the bears here.


Lastly, the Nasdaq 100 has exceeded it's early August high, but has done so without the Nasdaq Composite, Dow or S&P doing so as well. This is now two daily closes it's done which is potentially very bearish. We had similar non-confirmations in indices at the last high in early August and look what happened there.
The only potential problem I have here is that it's the Nasdaq that's surging to new highs with the blue chips lagging. Usually the higher risk indices lead the market higher, so perhaps the Nasdaq 100 is just breaking out higher first and the blue chips will soon follow. It's possible. But the Russell 2000, XLF (financials), and the Nasdaq Composite are also higher risk markets and they've failed to make new highs. So if the bulls say the NDX making new highs is bullish, it's a very weak arguement with other risky markets failing to follow suit.
So the evidence leans in favor of the bearish side as far as this lonely new high in the Nasdaq 100. If Nasdaq 100's lonely new high holds, then when you combine the VIX market sell signal with the multiple momentum divergences being registered, then you have a high possibility for a very significant top being in. We'll see if the August highs hold in the other indices the rest of the week. But we might find out as soon as tomorrow.
And remember, for all you longer term outlook folks, keep an eye on the bigger picture. Check out the article, 3 Reasons Now is Not the Time to Speculate in Stocks, for perspective on this.
PLEASE NOTE: THIS IS JUST AN ANALYSIS BLOG AND IN NO WAY GUARANTEES OR IMPLIES ANY PROFIT OR GAIN. THE DATA HERE IS MERELY AN EXPRESSED OPINION. TRADE AT YOUR OWN RISK.
3 comments:
I follow it for sentiment...and at some point might take positions in it. I personally think bond yields will rise dramatically in coming months/years
Are you playing the bond market at all? I've been short TLT for about two weeks now. I'm not much of a bond trader at ll, but I follow them to get the pulse on sentiment like you.
high yield bonds (ticker jnk) just another sign how euphoric the market is
Post a Comment