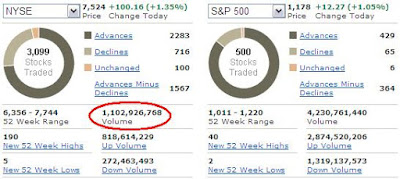
Internals today snapped back and tried to return fire from yesterday's big bearish decline. But the bulls did not succeed in matching the bears' intensity. Yesterday the bears moved the market down big with 1.27 billion shares and today the bulls could only muster up 1.1 billion shares; the bears had 89% of NYSE volume to the downside while the bulls only got 74% to the upside today; yesterday's NYSE decliners were at 2484 for the bears while today the bulls only had 2283 advancers; and the bears got 460 S&P stocks to close lower while the bulls had 429 close higher today. So the intensity of the two moves belongs more to the bears than with the bulls. I know this is only one day and it may not speak well to the bigger picture in and of itself. But when you combine this evidence with the fact that over the past several months declines usually have big volume and the rallying has lighter volume, then it shows an internally weaker bullish underpinning to the rally. And that often means the move is corrective in nature.
With that said, we've been talking about a weakening uptrend for months and the market has continued higher. So we have to drill down the evidence deeper to get the specifics of where the market is moving in the short term.
The break above the key levels I cited yesterday (Dow 11,068 and S&P 1177) signal that the decline from Monday was just a 3 wave move, which is a correction. Also note that the Dow is looking like it's heading to a resistance area at 11,150 that's been tested twice already (see a 10 day chart). For it to stop again around that area would make it a triple top, and triple tops are extremely rare. The evidence for the short term action suggests the bulls are still in control. Even if the market doesn't make new highs and reverses from current levels, it could just mean that the above labeled ABC zig-zag correction is unfolding into a "combination correction" which would have it work its way lower in another ABC zig-zig correction to new lows in the coming days before surging higher to new highs.
Only an extremely sharp and deep impulsive move lower would put this current unfolding downward corrective count in jeopardy. The bullish count above is my primary count right now.
This is the alternate count that is aggressively bearish. For those who are Elliott Wave Principle "purists", you'll notice this leading diagonal does not have overlapping 4th and 1st waves so it's not possible to count it this way. That's fine, it can simply be counted as a 5 wave decline without the diagonal labeling. But it would be a real stretch if that were the case since it would not have EWP's guideline for the "right look", and the ensuring corrective rally is extremely sharp and deep.
The reason I like this count being of at least a diagonal-like structure is because the waves lower get smaller and smaller and weaker and weaker as the market moved lower, then had a huge sharp straight up rally today. All of which is typical behavior of the action during and following diagonals. Also, the bearish 5 wave count lower remains valid since after the intitial surge this morning, the bulls hit a wall and could not accelerate it higher into the close. Combining this with the weaker internals that accompanied yesterday's big bearish move helps support this above wave count as well.
For this account to remain in contention, a sharp impulsive move lower must occur from near current levels very soon.
Free article: October Curse vs. Objective Analysis: The Choice Is Yours.
Although the divergence of financials from the rest of the market is front page news on the financial media and blogosphere, it's still a significant development and should be noted. The financials continue to lag the blue chip indices drastically as the daily chart comparison with the Dow shows. Eventually, one of these two will have to give way and move in line with the other's trend. At this juncture, it seems that the blue chips will turn lower and follow financials eventually. But when??? That has been the challenge for the bears.
The euro rallied with stocks today. In fact, early in this morning's US session the euro was surging higher while stocks where just treading sideways-to-up slowly. Stocks eventually followed the euro aggressively higher where both markets hit a brick wall and halted for the rest of the day. Stocks broke their key levels today (1177 S&P and 11,068 Dow), but the euro did not exceed its key level at 1.4005. At least not yet. I don't have much confidence that this high will hold, but if it doesn't it probably means a test at the 1.4150 level in the near future. I believe China is putting some data out at 10pm EST tonight, so perhaps this will move the euro, and the futures, strong enough in a direction that can give us some answers to help clear up the short term bull/bear arguement and hint what we can expect tomorrow.
Video: The Versatility of the Wave Principle
Timeless Trading Lesson
In the video below, EWI senior analyst and trading instructor Jeffrey Kennedy shows how the Wave Principle can help you identify a high-probability trade set up regardless of the direction of the larger trend.This timeless educational video was taken from Jeffrey's renowned Trader's Classroom series and is being re-released because of its valuable lesson. If a few minutes isn't enough, get more FREE practical trading lessons from Jeffrey Kennedy in his latest eBook.
PLEASE NOTE: THIS IS JUST AN ANALYSIS BLOG AND IN NO WAY GUARANTEES OR IMPLIES ANY PROFIT OR GAIN. THE DATA HERE IS MERELY AN EXPRESSED OPINION. TRADE AT YOUR OWN RISK.


No comments:
Post a Comment