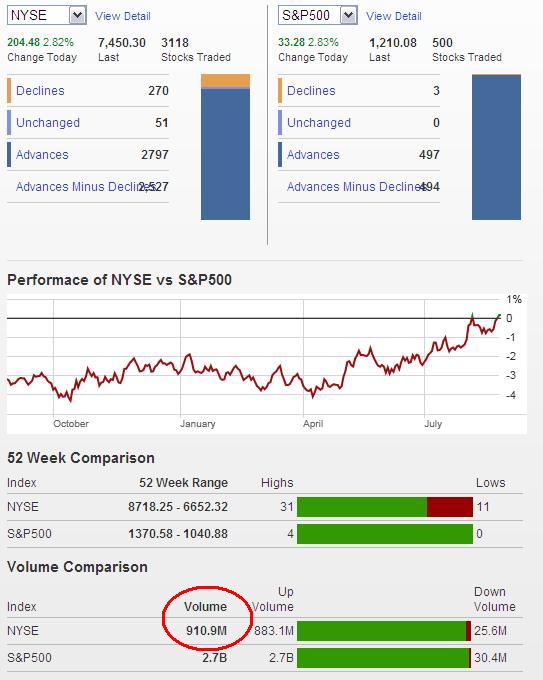
The S&P made a new high today, negating the possible 5 wave decline following the proposed Minor wave 4. I would have gotten long this market today if volume wasn't so low. Today the NYSE couldn't even bust through 1 billion shares on this huge surge today. That's troubling for this rally right now.
Behind Closed Doors at the Fed: Ten Years of Research into America's Central Bank

EWP has a small set of rules that absolutely must be followed when developing a wave count. And EWP has even more guidelines that are "best practices" so to speak, that allow for wiggle room to fudge and disregard under certain circumstances and scenarios. One of those guidelines is EWP's "right look". For example, if the S&P dropped in what looks like an impulsive 5 wave move without violating any EWP rules, but wave 2 rallies 20 points over 3 days and wave 4 rallies 150 points over 3 months, then something is most likely wrong with the wave count labeling, most likely with the degree of trend.
Right now we don't have that severity in wave discrepency, but wave 4 is getting quite long in time, and today's new high doesn't help matters, so it's making me uncomfortable continuing to try and short here. The only thing keeping me from getting long here is volume. Notice on the SPY (S&P ETF) chart above that on this current rally phase we're in volume has continued to decline. That doesn't strike me as the behavior I'd expect to see at the start of a new bull market, but rather the behavior I would expect to see in a correction. So I have conflicting views here which are rendering me immobile, like when the Joker would tie Batman up in an elaborate way to destroy him. Only I'm not Batman, and I don't have a trusty tool belt with wonderful toys to get me out of a jam. I only have a computer and some cheap scotch to help me.
The make or break point for Minor wave 4 to end is 1295.92. Risking 85 S&P points here with a questionable wave count is too risky for my blood. But if the market falls hard with little 5 wave moves and strong volume this week, I'd be willing to get short with a stop just above that day's high.
Learn Elliott Wave Principle

The euro might be trying to break out of its consolidation to the upside. I'm still neutral this pair and don't have a trade here.
7 comments:
Hi Todd,
You said, "...but wave 2 rallies 20 points over 3 days and wave 4 rallies 150 points over 3 months."
???
Can you kindly elaborate.
Cheers.
My guess is if the SP easily takes out 1220 and heads towards 1260, then the move down to 1101 was A of a cycle 2 correction (of SC V) and the move up is B, waiting for C to make a new lower low sometime next year. With this extended rally, even on light volume, I'm having a hard time believing its wave 1 of P3 down. Horrible economic numbers this week could help change my mind, but I don't think they'll be that bad.
a was "corrective" wave from 1101 to 1208.
c was "corrective" wave from 1121 to 1228 if a=c.
It is normal 2nd, 4th wave c is higher than a and low volume is part of corrective wave feature.
Hi JL, I was just using that as a hypothetical example of how EWP's "right look" would not apply in general. I did not mean it literal, as if that's what was occurring right now. That's why I went on to say, "Right now we don't have that severity in wave discrepency..."
Sorry for the confusion.
Todd
You still feel it's not P3 even though the low volume is on corrections/rallies? We had 2.6 billion shares traded on the way down.
Just a thought.
Todd
50% fibo retracement of Minor wave 3 is at 1225 as well. So 1225-1228 are good reversal levels to watch.
I think economic conditions provide a potential for a P3 down, but I'll have to see it to believe it. As of today all indicators on any chart (from 5 minute to daily) are near-term bullish. For instance, the SP daily confirmed a bullish MACD cross Monday. So I'm thinking one more higher high towards 1230ish before any chance for another move down. There are many counts out there looking for another low beneath 1100 but not as part of a P3 move.
Post a Comment