Thursday, September 15, 2011

Stocks Should Reverse in Wave ((d)) Now; Euro Looking at 1.4000


The price action in stocks was strong today but internally it was a weak move.  The recent rally has been relentless in price, yet volume and advancers vs decliners has weakened.  The rally looks corrective and the next big sustained move should be down.  We just have to wait.

Check out the new EWI video on MACD momentum analysis at the bottom of this post, or get a free technical indicators report now.


The limits of the triangle interpretation above are being pressed with today's big rally.  Wave ((c)) cannot go above the top of wave ((a)).  Doing so would negate the triangle count and create some concern for the bears from an EWP standpoint.  But as I said earlier, with internal strength declining as the rally chugs on, the market's larger downtrend appears to still be intact regardless.  Wave ((d)) down should start almost immediately.


The 1.4000 appears to be in the euro's sights at this time.  Although the euro's rally the past few days has been choppy suggesting it's a correction, it has held its series of higher highs and higher lows.  So the short term trend remains up.  Until that uptrend is broken, look for the euro to get to the 1.4000 level.  I expect firm resistance at that level and believe it will mark a breat area for it to reverse and continue its larger downtrend.

Momentum Analysis Using MACD

Learn more about using Momentum analysis to make Elliott wave trading decisions in this video by EWI European Interest Rate Analyst Bill Fox. Find more lessons on technical indicators in EWI's newest free report. See the information below.


Learn the Best Technical Indicators for Successful Trading


In this free report, you will learn the tools of the trade directly from the analysts at Elliott Wave International. This free report uses both video lessons and reports to teach you how to incorporate technical indicators into your analysis to improve your trading decisions. Get your technical indicators report now.


PLEASE NOTE: THIS IS JUST AN ANALYSIS BLOG AND IN NO WAY GUARANTEES OR IMPLIES ANY PROFIT OR GAIN. THE DATA HERE IS MERELY AN EXPRESSED OPINION. TRADE AT YOUR OWN RISK.

Wednesday, September 14, 2011

Wave ((d)) of Triangle Underway


Not much new to add from yesterday's post.  I just wanted to put up today's internals that support the 4th wave triangle scenario I mentioned in yesterday's post.  1.1 billion shares traded on the NYSE today and uppers vs downers and up/down volume was bullish but nothing jaw dropping.  The late day big decline is probably just wave ((d)) of the triangle getting underway which should continue tomorrow.  The range for the market should continue to tighten the rest of the week and probably into early next week before a big surge to new lows for Minor wave 5.  A good bottoming range for the S&P is the 1050-1100 area.

I'll post more as things develop or change.  Please check out yesterday's post below for an in depth look of how I view the market right now as well as the count I'm tracking.

Tuesday, September 13, 2011

Stocks Might be in Triangle, but does it Matter Right Now?

No, it doesn't matter right now, in my opinion.  There are several interpretations of wave labels that are in play.  I listed a few last week.  But all have one thing in common, a new low beneath 1100 (Minor wave 3 in the above chart).  So I don't want to get caught up in trying to exactly pin the market down to which count is correct.  I want to just ride the wave down and see what happens once new lows are made to determine if I should hold short, or cover.

The up-down nature of the market lately with almost no net result positive or negative combined with weakening volume suggest a triangle might be forming. I labeled it above.  A triangle would be very good for wavers because triangles only occur in X, B and 4th waves.  So a triangle will significantly help us narrow down the larger wave count with higher probability and help us predict with more certainty of future movement.  Triangles also precede terminal thrusts, meaning that a sharp move will occur when the triangle is finished and then reverse completely.  So short term traders can make quick profits with little risk on that thrust.

Let's keep tracking this triangle count.  Of course it's all about probabilities and I'm not 100% sure the triangle is occurring right now.  But it's definitely a tradeable structure for those familiar with the rules for a tirangle.  But still, keep in mind we might also be in a 5th wave down and they are often tricky.  Many times one or just a few indices will make new lows, or only do so on a closing basis, making it tricky to know when to get out before a big reversal.  So I'm keeping a close eye on the overall market looking for any sign that may have us conclude a major bottom is in.  Right now it doesn't appear we're there quite yet.

Check out the new EWI video on MACD momentum analysis at the bottom of this post, or get a free technical indicators report now.


Counting waves here would be sloppy and irresponsible in my view.  I need more of the structure to unfold before doing so.  Labeling the chart now could only be done if I were to be very very creative.  And that baiscally means I'm forcing my own bias onto the market and making my wave counts support my bias.  I don't want to do that so I'm just looking at chart basics.  And those basics say the euro looks broken down here with more to go on the downside.  As I said many times the past few weeks, the euro's multi-week consolidation would result in a sharp move in either direction.  That direction was down, obviously, and it doesn't appear over.  It's probably just taking a breather before falling lower.  There's no evidence a bottom is in so I favor the short side.


Momentum Analysis Using MACD
Learn more about using Momentum analysis to make Elliott wave trading decisions in this video by EWI European Interest Rate Analyst Bill Fox. Find more lessons on technical indicators in EWI's newest free report. See the information below.


Learn the Best Technical Indicators for Successful Trading


In this free report, you will learn the tools of the trade directly from the analysts at Elliott Wave International. This free report uses both video lessons and reports to teach you how to incorporate technical indicators into your analysis to improve your trading decisions. Get your technical indicators report now.


PLEASE NOTE: THIS IS JUST AN ANALYSIS BLOG AND IN NO WAY GUARANTEES OR IMPLIES ANY PROFIT OR GAIN. THE DATA HERE IS MERELY AN EXPRESSED OPINION. TRADE AT YOUR OWN RISK.

Thursday, September 8, 2011

Stocks Reverse, but on Light Volume; Euro Accelerates Towards 1.3800


Today's market reversal was nice, and also very predictable in real time.  The market surged to get solidly positive after starting the morning sharply lower.  So it seemed the bulls were back in control.  However I looked at the euro and it was still trading heavy by blazing new lows still.  And looking at the bank ETF (XLF), it was almost 0.5% negative while the major indices were surging well into the positive.  That divergence was enough to get me to add to my small short S&P position.  Immediately after that, the market tanked and didn't look back the rest of the day.  Good news for a bear like me.  But looking at the end of day data, I'm no longer impressed.  Volume stood at only 945 million shares which tells me today's decline might just be some mild profit taking before Obama's speech, and I believe the Fed spoke today too.  So I'm unsure if a top is in right now based on the volume I saw today, and the wave count isn't helping much either because it leaves the possibility for one more high before topping.  So the door is still open for a short new high tomorrow or Monday.

Those Steely-Eyes of J.P. Morgan: Could They Help Us Today?


The rally from the Minuette wave (i) low looks impulsive.  This means that it's probably just the first leg of a longer and larger correction.  So today's decline is probably a "b" wave, and wave c will complete Minuette wave (ii).  I'm not certian at all this will occur though since the correction is already quite deep.  A top may already be in.  Either way, the Minor wave 4 high should not be exceeded and the risk/reward favors the bears here shorting into rallies, in my opinion.

Learn Elliott Wave Principle


Ah, Mr. Euro finally does what he's told and falls hard from his consolidation earlier.  The move to 1.3800 I've been calling for is near and should be accomplished quite shortly.  Whether that level acts as a floor for the euro to bottom at, or just a speed bump it blasts through, I'm unsure of.  But the path of least resistance now is still down in my view.


PLEASE NOTE: THIS IS JUST AN ANALYSIS BLOG AND IN NO WAY GUARANTEES OR IMPLIES ANY PROFIT OR GAIN. THE DATA HERE IS MERELY AN EXPRESSED OPINION. TRADE AT YOUR OWN RISK.

Wednesday, September 7, 2011

Stock Rally is Corrective; Euro to Head Lower


Stocks surged big today and held strong all day, closing on the highs.  But unfortunately for the perma-bulls, volume again was very light with only 953 million shares traded on the NYSE.  This is very light, and tells me that most likely this rally is corrective.  When volume returns, the market should fall.

Those Steely-Eyes of J.P. Morgan: Could They Help Us Today?


Today's rally is part of Minuette wave (ii) which should stop short of exceeding the Minor wave 4 high.  This means it offers the bears a good risk/reward opportunity here since the potential profits from breaking August's lows are far greater than putting a stop just above Minor wave 4's high.

Minuette wave (ii) may not be over though.  Despite light volume, the market was strong all day and closed on the highs suggesting there is more upside to go.  Whether that small upside occurs tomorrow morning and then reverses, or we get a slight drop and then some upside, is unknown.  Either way, the market looks bearish overall as Minor wave 5 is underway suggesting August's low will be taken out.  I would be shorting rallies.

Learn Elliott Wave Principle


After a very long and tightening consolidation the euro has finally broken out and has done so to the downside.  I'm looking for this pair to head toward the 1.3800 level in the near future.

PLEASE NOTE: THIS IS JUST AN ANALYSIS BLOG AND IN NO WAY GUARANTEES OR IMPLIES ANY PROFIT OR GAIN. THE DATA HERE IS MERELY AN EXPRESSED OPINION. TRADE AT YOUR OWN RISK.

Tuesday, September 6, 2011

Stocks and Euro Tank


Stocks fell hard today, but volume was modest and advancers vs decliners data was fairly bearish.  But looking strictly at internals here, they are not exactly supportive of a resumption of the larger downtrend.  That doesn't mean the larger downtrend hasn't resumed, it just means that this piece of data isn't all that supportive.


I think various longer term counts are in play here, although all the major ones I'm tracking have the market heading to a new low before bottoming out.  It's because of that fact that I don't want to get too caught up in solidifying a longer term count, and measuring corresponding waves, and looking for exact points of movement.  In my opinion, that's a waste of time.  It works for a lot of people though, but not me.  I just stick to the bottom line and simplist analysis.  In that light, the market needs a new low so I'll trade for that to occur and deal with the bigger picture once we see the structure and strength of the move AFTER the new low.

Above is one valid way of counting the decline.  Here, Minor waves 2 and 4 are much more proportionate to each other, yet it means the S&P topped much earlier than the Nasdaq 100, and the discrepencies in wave counts will result in serious problems to at least one of the two counts over time.  But looking at the S&P on its own, this count above is very much in play.

Learn Elliott Wave Principle


Here is another possible count I'm tracking at the moment.  This falls more in line with the top in the Nasdaq 100, which tends to lead the overall market, or at least signal major turns.  The problem is that Minor wave 4 is much longer in time than Minor wave 2, making this count a bit undesirable, yet still valid.


This count basically follows the Nasdaq 100 exactly and suggests Intermediate wave (1) actually completed at August's low and the rally that completed last week was Intermediate wave (2).  This count would put the Nasdaqs and blue chip Dow and S&P indices right on track with each other.  The big problem right now though is volume and internals.  If we were now in Intermediate wave (3) down I'd expect to see volume well above 2 billion shares and around 98%-99% down volume.  We're not even close to that right now.  So this count is also merky at best right now.

The bottom line is that we can go forever developing scenarios and counts that may seem likely what I want to focus on is the bottom line, and what's the simplist way to approach this.  The bottom line is that the market should be headed lower to a new low and we have to let the market action play out a little more before we get married to a longer term count.  Playing the short term while leaving the longer term open for interpretation for the moment is certainly a viable strategy right now.


The S&P traced out a nice 5 wave decline from the Minor wave 4 high.  So the big corrective rally that occurred today was expected, and it might also explain why the internals were only modest at the close since the whole day's data is averaged out, and the big corrective rally diluted the bearish internals from the open.  Regardles,  once this correction is over, the market should continue its way lower in a hurry, regardless of what the longer term count is.

Those Steely-Eyes of J.P. Morgan: Could They Help Us Today?


The euro is continuing to breakdown, and it's doing it in an orderly fashion as it closed a gap left from Sunday's open before resuming its downtrend.  I suspect 1.3800 should be reached rather quickly.

PLEASE NOTE: THIS IS JUST AN ANALYSIS BLOG AND IN NO WAY GUARANTEES OR IMPLIES ANY PROFIT OR GAIN. THE DATA HERE IS MERELY AN EXPRESSED OPINION. TRADE AT YOUR OWN RISK.

Friday, September 2, 2011

Wave 5 Begins for Stocks; Euro Trying to Break Down

Minor wave 4 has gone on long enough to where this sharp decline from late yesterday and into today is enough for me to play a top being in.  Minor wave 4 is much much longer in time than Minor wave 2, making me a little uncomfortable with this count.  But it's the best count I have at this point, and we trade based on probabilities, not certainties.  Minor wave 5 should move rather quickly to break below 1100, and possible to around the 1050 area before a bottom should be considered.

Those Steely-Eyes of J.P. Morgan: Could They Help Us Today?
"The Panic of 1907" vs. the "Debt Crisis" of 2011
-Elliott Wave International


Above is my alternate count.  I know, you want to slap me and shake me violently to knock some sense into me.  But I'm not trading based on this count, I'm trading based on the more likely and more conservative count I mentioned all the way at the top of this post.  But this count here needs to be kept in mind as the market falls.  If the market falls very sharply with very bearish internals and high volume, then we need to give more respect to this count's possibility.  If this count is correct, then the market will be headed significantly lower in a hurry, and we don't want to miss that.  But we also don't want to blindly "hope" for this count to be correct and end up getting our faces ripped off on a monster rally if we're wrong.

This reason this count seems possible to me is because it would explain why the recent rally took so much longer than its corresponding rally I originally labeled Minor wave 2.  There isn't very good proportionality there.  And although it doesn't violate any EWP rules, it doesn't adhere to EWP's guidelines for a "right look".  But the big problem with this count is that Intermediate wave (1) looks much more like a 3 wave decline than a 5 wave impulsive decline.  So that's a big problem to overcome.  It's possible to get real creative and cram an impulsive wave count into Intermediate wave (1)'s subdivisions.  But I don't like to "cram" anything since doing so usually means the count is wrong and that I've fallen victim to my own biases causing me to force the count I want onto the market instead of letting the market tell me what the count is.

Anyway, I'm playing the market based on the count at the top of this post which means I'm expecting a move to at least the 1100 level.  I have a very small short position and will take profits on a break below 1100 unless volume and internals are so severely bearish that it warrants adhering to the other more aggressively bearish count.

Learn Elliott Wave Principle


The bearish side of the euro is looking good here.  After a tight consolidation pattern and false breakout to the upside, the euro is declining impulsively to the downside.  I favor the short side on this pair, which means I'm bullish the US dollar.

PLEASE NOTE: THIS IS JUST AN ANALYSIS BLOG AND IN NO WAY GUARANTEES OR IMPLIES ANY PROFIT OR GAIN. THE DATA HERE IS MERELY AN EXPRESSED OPINION. TRADE AT YOUR OWN RISK.

Wednesday, August 31, 2011

Stocks Reverse at Range Cited; Euro Breaks Down in Five Waves


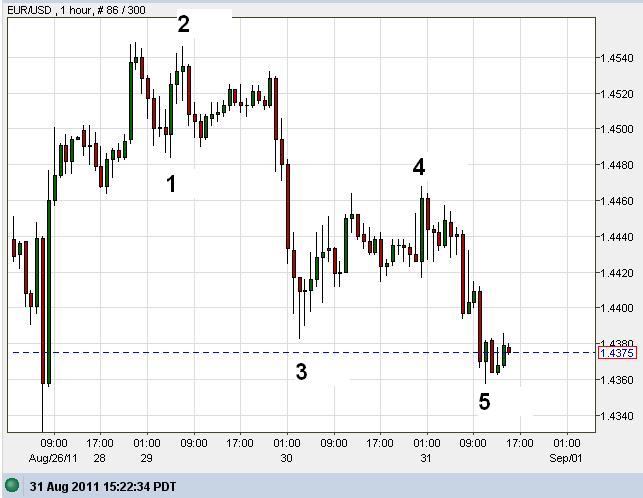
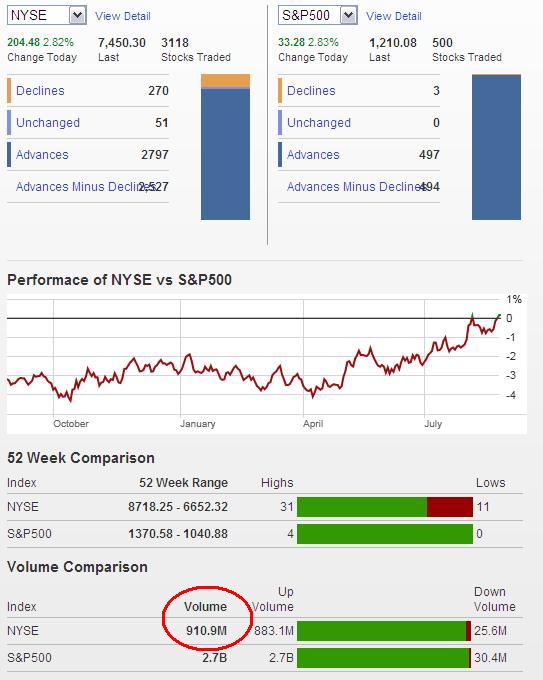
I wasn't going to post anything today but the euro declined in 5 waves and I wanted to post it.  Internals in stocks still show a feeble rally.  Volume increased today but still farely light relative to the declines the past several weeks, and end of month positioning is probably playing a role in the bullishness and uptick in volume now.  Plus, the ratio of buyers to sellers isn't that compelling to the bullish side either.  The rallying can easily continue until after the holiday Monday, but reversing at a nice level today opens the door to a selloff.

Behind Closed Doors at the Fed: Ten Years of Research into America's Central Bank


Yesterday I said to look for a reversal at the 1225-1230 area and we got that today.  Although I'm far from sure it's the mark of a top.  The reversal at the 50% fibonacci level certainly has my attention though.  I'm eager to add to my small short position if the evidence swings in favor the of the bears overnight or tomorrow.

Learn Elliott Wave Principle


Simply put, the euro and and the pound declined in 5 waves against the dollar which has me looking to the downside for the "breakout" I've been talking about the past couple weeks or so.  I'd be looking to short into any rally I can get with a stop just above the start of the euro and/or pound's 5 wave decline.


PLEASE NOTE: THIS IS JUST AN ANALYSIS BLOG AND IN NO WAY GUARANTEES OR IMPLIES ANY PROFIT OR GAIN. THE DATA HERE IS MERELY AN EXPRESSED OPINION. TRADE AT YOUR OWN RISK.

Tuesday, August 30, 2011

Hurricane Irene Washed the Volume Away; Euro Trying to Breakout


It looks like the hurricane might have washed out the Wall Street players here as volume remains very light and is preventing me from trying to get long this market.  Instead, I took a very small short position on today's weakness and plan to add short until volume reappears.

Behind Closed Doors at the Fed: Ten Years of Research into America's Central Bank


The above count seems to be the best shot at a short term count.  It shows Minor wave 4 as a double zig-zag correction.  I do feel this count is not very likely when looking at it all by itself because Minor wave 4 has become quite long in time compared to Minor wave 2, making it hard to be confident in EWP's "right look" guideline.  But with volume so low on the recent rise, and the longer term wave count appearing to still be incomplete to the downside, I'll hang on to this above count as long as it remains valid.  A big surge in volume with an upside move might change that view in a hurry though.  I want to be very nimble right now since I don't have high confidence in either side of the market at the moment.  But the wave count suggests I should be trying to get short when opportunities arise.

Today's late day reversal near 50% fibonacci retracement (1225) might signal the top of Minor wave 4.  Follow through to the downside tomorrow in an impulsive manner will add evidence to this outlook and suggest the aggressive short term bears take a shot at the short side.  If not, look for the 1225-1230 area to be reached before a significant reversal occurs.

Learn Elliott Wave Principle


The euro still can't break out, but it's trying to, and will.  The triangle consolidation has tightened significantly that will result in a sharp move in either direction.  I can only guess that the move will be to the downside, but that guess is not a good reason to attempt getting short here.  I remain on the sidelines here.

PLEASE NOTE: THIS IS JUST AN ANALYSIS BLOG AND IN NO WAY GUARANTEES OR IMPLIES ANY PROFIT OR GAIN. THE DATA HERE IS MERELY AN EXPRESSED OPINION. TRADE AT YOUR OWN RISK.

Monday, August 29, 2011

Stocks Continue to Surge, but Volume Disappears; Euro Trying to Breakout


The S&P made a new high today, negating the possible 5 wave decline following the proposed Minor wave 4.  I would have gotten long this market today if volume wasn't so low.  Today the NYSE couldn't even bust through 1 billion shares on this huge surge today.  That's troubling for this rally right now.

Behind Closed Doors at the Fed: Ten Years of Research into America's Central Bank


EWP has a small set of rules that absolutely must be followed when developing a wave count.  And EWP has even more guidelines that are "best practices" so to speak, that allow for wiggle room to fudge and disregard under certain circumstances and scenarios.  One of those guidelines is EWP's "right look".  For example, if the S&P dropped in what looks like an impulsive 5 wave move without violating any EWP rules, but wave 2 rallies 20 points over 3 days and wave 4 rallies 150 points over 3 months, then something is most likely wrong with the wave count labeling, most likely with the degree of trend. 

Right now we don't have that severity in wave discrepency, but wave 4 is getting quite long in time, and today's new high doesn't help matters, so it's making me uncomfortable continuing to try and short here.  The only thing keeping me from getting long here is volume.  Notice on the SPY (S&P ETF) chart above that on this current rally phase we're in volume has continued to decline.  That doesn't strike me as the behavior I'd expect to see at the start of a new bull market, but rather the behavior I would expect to see in a correction.  So I have conflicting views here which are rendering me immobile, like when the Joker would tie Batman up in an elaborate way to destroy him.  Only I'm not Batman, and I don't have a trusty tool belt with wonderful toys to get me out of a jam.  I only have a computer and some cheap scotch to help me.

The make or break point for Minor wave 4 to end is 1295.92.  Risking 85 S&P points here with a questionable wave count is too risky for my blood.  But if the market falls hard with little 5 wave moves and strong volume this week, I'd be willing to get short with a stop just above that day's high.

Learn Elliott Wave Principle


The euro might be trying to break out of its consolidation to the upside.  I'm still neutral this pair and don't have a trade here.


PLEASE NOTE: THIS IS JUST AN ANALYSIS BLOG AND IN NO WAY GUARANTEES OR IMPLIES ANY PROFIT OR GAIN. THE DATA HERE IS MERELY AN EXPRESSED OPINION. TRADE AT YOUR OWN RISK.

Thursday, August 25, 2011

Stocks Reverse Right at 1190, More to Selling to Come; Euro Set to Breakout Hard


Stocks reversed nicely today but volume held at the same level it's been at the past few days while it was rallying.  Probably the same folks who bought up this market just took profits today, lol.  I would have expected to see higher volume for the kickoff of Minute wave ((iii)) down of Minor wave 5, but with most people waiting for Bernanke's comments tomorrow, the big volume probably won't come in until Friday or Monday.  And I expect that volume to be slanted heavily on the sell side.


Using simple candlestick analysis you can see that the daily S&P cash chart shows a nice reversal pattern was put in today.  A strong new high was made today compared to yesterday, and then a new low was made compared to yesterday, and today's close was beneath yesterday's open.  All-in-all, a bearish formation.  I expect today's high to remain intact for at least a few days while the market falls hard.

Learn Elliott Wave Principle


For those of you who grew up watching the TV show The A-Team you'll appreciate it when I say, "I love it when a plan comes together" (Hannibal Smith).  Yesterday I said to expect a reversal at the 1190 area in the S&P since there is a gap there and a 78% fibonacci retracement level.  Even I was surprised to see the market turn on a dime right at that level.  Today's reversal looks good on so many levels, i.e. fibonacci retracements, EWP requirements/structure, candlesticks, gap behavior, etc.  The only problem with today's decline is the structure.  It is far from a good impulsive decline, so far.  But if it's the beginning of a larger down move, such as a Minute wave ((iii)) down, then there is some wiggle room for the early stages of the decline since further price action can easily clear up the short term's lack of clarity.

I expect today's highs to remain intact and the market to fall hard Friday and/or Monday.  A break above today's high will probably mean the Minor wave 4 high will also be broken soon as well.  So as long as today's highs remain intact, I'm firmly bearish in the short term.  The risk/reward strongly favors the bears here.


The GBP/USD traced out a 5 wave decline and made me a quick 100 pips in less than a day so I closed my short position this morning.  I feel the pair can easily continue lower but I don't want to be greedy.  Looking at the EUR/USD above, the sideways consolidation has really tightened lately, suggesting it is about to breakout hard and fast.  Looking at the daily chart alone would have me thinking the pair will breakout to the upside, but the series of lower lows in combination with the fact that it appears gold has formed a major top, have me leaning towards the euro breakout happening to the downside.  I expect gold and the euro to fall hard in the coming days.


PLEASE NOTE: THIS IS JUST AN ANALYSIS BLOG AND IN NO WAY GUARANTEES OR IMPLIES ANY PROFIT OR GAIN. THE DATA HERE IS MERELY AN EXPRESSED OPINION. TRADE AT YOUR OWN RISK.

Wednesday, August 24, 2011

Stock Rally Nearing Reversal; Euro Messy, but British Pound Very Bearish


Internals today were solid on the bullish side but nothing spectacular.  You can see a slight decrease in momentum from yesterday as volume was slightly down as well as advancers on the S&P.  Nothing very telling from this though, other than there seems to be little interest in buying up the market here from the big players.  I think a lot of this is just short covering going into Bernanke's speech on Friday, and relieving the oversold condition the market got into after the past few weeks.  The market can certainly float higher and higher on light volume, but the risk/reward of trying to follow a light volume move after a massive selloff is not good in my view.  So I'd be looking to short, and I have been.  Volume on this rally tells me it's a countertrend move, not the start of a new bull run.


The stock market had a nice reversal midday which showed some promise but was quickly erased and new highs were established telling us Minute wave ((ii)) is not over.  I zoomed in on the wave count I'm tracking above.  The conclusion of Minute wave ((ii)) is near.  The market rally seems to be fueled by short covering on risk reduction going into Bernanke's speech Friday as well as the hopeful perma-bulls thinking Bernanke will say something magnificant Friday.  I have no idea what will happen, nor do I care.  The charts are what talk to me and....shhhhhh, .listen.......(whispering) the charts are telling me that Minute wave ((ii)) is almost finished and a reversal to the downside is near.  And just in time for Bernanke's comments Friday.  There's an open gap and a fibonacci retracement level at the 1190 area that should mark a stopping point for this rally, if not sooner.  If correct, the selloff from there will be huge, at least 70 S&P points in a hurry.  But a break above 1208.47 will invalidate this bearish view and put me on the sidelines until things clear up.

Bottom line: the markets are eyeing Bernanke's Friday comments, so look for the timing of the reversal to be between Thursday and Monday, and look for the price of reversal to be at around 1190 in the S&P cash index, if not sooner.  Only a break above 1208.47 will negate this bearish view.

Learn Elliott Wave Principle


Well the euro may be a mess, but the Brisith pound is telling us a very clear story here, and it's bearish.  The 4hr chart I made this morning is above and shows a nice clean head and shoulders top accompanied by textbook diverging momentum during the head and shoulders process.  The break of the neckline and sharp selloff is a clue that this pair is in trouble.  Despite the euro holding firm, the fact that the British pound has appeared to have topped against the US dollar, and gold's big top and selloff today, it's possible the US dollar is set to surge big here, which is bearish for the GPB and EUR and other majors. 

I got short the GBP/USD today, I think the dollar is set to surge while gold and silver continue to freefall.

PLEASE NOTE: THIS IS JUST AN ANALYSIS BLOG AND IN NO WAY GUARANTEES OR IMPLIES ANY PROFIT OR GAIN. THE DATA HERE IS MERELY AN EXPRESSED OPINION. TRADE AT YOUR OWN RISK.

Tuesday, August 23, 2011

Stocks' Bounce Anemic, Downtrend Not Complete; Euro Still a Mess


Prices sure took off higher since my post this morning.  The surge in price is what I'd expect to see when a significant bottom is put in place, and the advance/decline ratio as well.  However volume was quite light today relative to the past few weeks at only 1.2 billion shares on the NYSE.  If this were significant bottom being put in place to kickoff Intermediate wave (2) higher, I'd expect to see much higher volume on the move today.  The light volume today tells me the big shots and heavy players needed to put in a bottom were absent today.  This morning's post still stands despite the big surge in the second half of trading today.


I just wanted to report that I'm starting to lean more towards the alternate count I put up in the last post.  The market is bouncing as I expected but my top count from last post suggests a major bottom of Intermediate wave (1) which means Intermediate wave (2) up would theoretically be underway now.  There are two major problems with thinking Intermediate wave (2) up has started though:

1) most major indices/sectors have not made new lows beneath their Minor wave 3 extremes; and

2) the bottom and rally has been anemic in price action and internals.  I would expect a more violent move off the lows, or a much larger and internally stronger push higher to kickoff such a large wave that Intermediate wave (2) would be. 

I don't see those two things here which tell me that most likely my alternate count is in play (see above chart).  This means that this current bounce is simply a Minute wave ((ii)), and when it ends, Minute wave ((iii)) down within Minor wave 5 will be underway.  This will be a pretty strong move to the downside that should have no problem taking most, or all, of the major indices/sectors to new lows.  So, as long as the S&P cash index stays below the Minor wave 4 high at 1208.47, this market is still bearish in my view.

Should Stock Investors "Fret Over Economy"? No -- See Chart to Understand Why


Learn Elliott Wave Principle

The euro is still a mess and no wave count can be determined here with high confidence, so I'm not going to "guess" and put one up.  It looks clearly corrective to me here which suggests a new high for the year is on the way.  But the recent move higher so far is also a choppy mess, suggesting we may have a sharp decline first.  Too many "ifs" and "buts" for this one so I'll avoid it for now.

My opinion is that the euro is experiencing a push/pull affect.  One example is that behavior in gold relative to the stock market.  Gold has been soaring to new all time highs and seems hell bent on getting to the $2,000 mark before exhausting.  But stocks have been plummeting during this time.  This push/pull of related forces on the euro has helped create the choppy price action you can see in the chart above.  I'm not sure how this will resolve though since when gold finally tops and reverses down, stocks should be headed up.  So which way will the euro go when that happens?  I have no idea, and since I usually depend on the EWP count for direction, I'm stumped.  I'm staying away.

PLEASE NOTE: THIS IS JUST AN ANALYSIS BLOG AND IN NO WAY GUARANTEES OR IMPLIES ANY PROFIT OR GAIN. THE DATA HERE IS MERELY AN EXPRESSED OPINION. TRADE AT YOUR OWN RISK.

Friday, August 19, 2011

Risk of Stock Reversal Increasing


I'm not too interested in reading the internals today since it was an options expiration day which can skew these numbers a bit.  However, considering the fact that there's usually heavy volume on option expiration day, the fact that there were only 1.5 billion shares traded lends itself to a Minor wave 5 outlook that is finishing up most likely.

And make sure you keep the bigger picture in mind and what it might mean for your long term portfolio:
See Prechter's "FREE FALL TERRITORY" Chart for Yourself


The more conservative way of counting the subwaves of Minor wave 5 is above.  I have 5 Minute waves almost complete which will wrap up Minor wave 5 very soon in the process.  I know that these waves are small for Minute waves relative to the prior Minute waves in this decline, but 5th waves often unfold imperfectly from what I've seen, so I'm planning for the most conservative scenario, which is above. 

I've removed most of my short positions to reduce risk.  The market has moved in my favor big enough and fast enough to warrant some profit taking at these levels.  Sure, Minor wave 5 can turn into an extended 5th wave and cascade downward to significantly lower levels.  But at this point that would just be a guess since there's no evidence to support that here, and the risk of a very large Intermediate wave (2) starting at any moment is great.  So the risk/reward for the bears here is not appealing to me.  So I took profits today.

Download Robert Prechter’s free report. - offer expires August 22nd


The other more aggressively bearish outlook is posted above.  In a perfect EWP world, and a world that I wasn't trying to reduce risk on my short positions, this count would be my top choice.  The count shows only a Minuette 5 waves completing here for Minute wave ((i)).  Meaning that after a corrective Minute wave ((ii)) rally, the market will continue much lower to complete all of Minor wave 5.  The possibility that this count may be in play is the reason why I kept a very small short position in place still.  If the structure clears up in the future to make this count a high probability, and the opportunity arises, I might attempt to re-enter on the short side if I can keep risk tight.  But for now, this count is only in the back of my mind as I try to reduce risk in preparation for a big Intermediate wave (2) rally.

SAVE 57% with this LIMITED-TIME OFFER: See what we see next for the markets now via this instant-access discount subscription offer.


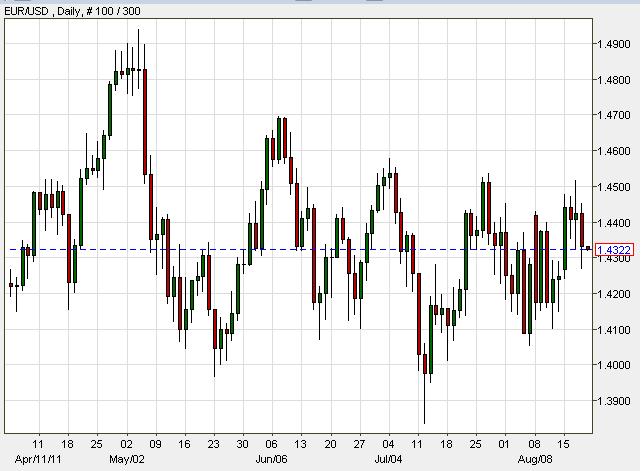
The euro arguably completed a 5 waves down with a sharp corrective rally today.  I didn't label the chart because I don't want it to be misinterpreted that I actually buy into the view that this proposed 5 wave decline is the start of a new downtrend, because I don't.  The daily chart of the euro shows what is clearly a corrective downward move by EWP standards, meaning the next big move is up.  Aside from the series of lower highs in place that keep me from getting long for now, the euro does look overall bullish to me here.  Stocks have sold off drastically the past few weeks yet the euro has held firmly still, partly because gold has been in a blowoff top - or vice versa.  So I don't see how the euro will all of a sudden tumble at the tail end of Intermediate wave (1) in stocks.  Most likely the euro is waiting for Intermediate wave (2) in stocks for it to start declining, or it's going to rally with stocks' Intermediate wave (2), then decline hard with stocks' Intermediate wave (3).  There are too many "ifs" and question marks here for me.  So I'm standing aside for now.

Learn Elliott Wave Principle


PLEASE NOTE: THIS IS JUST AN ANALYSIS BLOG AND IN NO WAY GUARANTEES OR IMPLIES ANY PROFIT OR GAIN. THE DATA HERE IS MERELY AN EXPRESSED OPINION. TRADE AT YOUR OWN RISK.

Thursday, August 18, 2011

Stocks' Wave 5 Down Underway; Euro a Mess


Simply put, the reversal signs I noted in yesterday's post were indeed the kickoff to Minor wave 5 down.  New lows are just around the corner.  Internals today were a blood bath as you might have imagined.  97.3% of NYSE volume was to the downside and almost all S&P stocks were down on the day.  But volume was not nearly as large as it was in the previous down move.  Today we saw only 1.6 billion shares traded instead of the 2.5 billion area we saw before.  This further gives us evidence that a 5th wave is underway since EWP states that 5th waves are often accompanied with diverging momentum relative to the previous 3rd wave at the same degree.  So the previous 3rd wave at the same degree had volume in the 2.5 billion range, and now the 5th wave is in the 1.5 billion range.  Typical behavior of 3rd and 5th waves which helps strengthen the top wave count.

Download Robert Prechter’s free report. - offer expires August 22nd


Speaking of wave counts, let's get some posted.  Normally I just like to get to the bottom line and not get too tied up with the details that really aren't relavent at that moment.  The bottom line was that a 3rd, 4th and 5th wave have been on our plates and the focus should be on that current up/down movement, not what the bigger picture wave counts might be which will onlly cloud the issue.  In general, up until now, all the wave counts virtually would result in the same up/down movements, so I just focused on that fact.  But now that we're entering a time where the wave count options will start to separate from each other, I want to post the counts I'm tracking closely to get a better idea of where to look in the future.

Above is the preferred count I'm tracking now.  It's a little different than what I've been posting the past few days because Minor waves 1 and 2 have move back one wave.  The internal strength of Minor wave 3 compared to the current Minor wave 5 make this count the most viable in my view.  New lows in the major indices should be just around the corner, but once those lows are achieved, perhaps in only some of the indices, there will be a very sharp and long Intermediate wave (2) rally.  I would not want to be caught holding short during that rally so I'm choosing to begin the exit of my short positions now.  I'll then reshort as the big Intermediate wave (2) rally gets underway as long as it has the characteristics of a countertrend rally (corrective).

And make sure you keep the bigger picture in mind and what it might mean for your long term portfolio:
See Prechter's "FREE FALL TERRITORY" Chart for Yourself


In a perfect world, this count would be preferred. The reason is because Minor wave 3 should subdivide into a little nicer 5 wave move, giving it the "right look" in EWP's guidelines.  But we don't live in a perfect world, and the market rarely gives us perfect EWP form.  In my opinion, the move down has been so great and the profits so large that ignoring the first count I posted and trading based on this count would just be greedy.  Even if this count here is correct, the market is going to make one more low anyway and getting out at that point to avoid being caught short in Intermediate wave 2's monster rally is well worth it in my view.  Trading is all about risk/reward in my view, not trying to squeeze out every last drop of profits out every move even when a larger countermove is imminent.

SAVE 57% with this LIMITED-TIME OFFER: See what we see next for the markets now via this instant-access discount subscription offer.


Lastly, there is a less bearish option as seen above.  Instead of an impulsive decline downward as I counted in the two above charts, here we have an Intermediate (A)(B)(C) decline that will end with a new low soon.  Wave Cs are 3rd waves and are equally destructive according to EWP, so we can't say the past few weeks of heavy selling can only be a wave 3.  It can also be a C wave.  This count will keep me honest on the next big rally phase.  I have to make sure that I analyze the rally carefully in order to determine if it's characteristic of a new bull run, or if it's just part of a correction.  Making that determination will be key in placing big bets on the next big move the market makes.

I know this is a lot to digest and can be a bit confusing to those not EWP savvy.  This is why I usually just focus on the bottom line and don't get too tangled in the details.  The bottom line though for the short term is that regardless of which count is correct, notice that in the short term all the counts agree that the markets are headed to new lows soon and will rally soon after that.  From there we can better determine which of the above counts we should eliminate depending on the size, structure and strength of the impending rally.

Learn Elliott Wave Principle


The euro is a mess and according to EWP, this is clearly a correction within a larger bullish move.  The euro's failure to collapse with stocks also strengthens the thesis that this is just a correction within a larger bull move.  The problem is that it can't make a new swing high on a daily basis, making it hard to get long right now.  But overall, I think that it's currently in a 4th or B wave within a larger upward correction.  Once the 5th or C wave rally is complete, which will probably be in conjunction with stocks' Intermediate wave (2) rally, then the euro should fall hard along with stocks' Intermediate wave (3).  But right now, I'm avoiding trading the euro.

PLEASE NOTE: THIS IS JUST AN ANALYSIS BLOG AND IN NO WAY GUARANTEES OR IMPLIES ANY PROFIT OR GAIN. THE DATA HERE IS MERELY AN EXPRESSED OPINION. TRADE AT YOUR OWN RISK.

StatCounter