Saturday, May 1, 2010

Market Has Topped; But at What Degree?


The market failed to complete a 5 wave rise from mid-week's lows and instead actually declined in 5 waves Friday. This behavior, along with it breaking below my key level of 1193 make me conclude that the trend is now down in the stock market. As you may recall, earlier this week I had a "flat" correction labeled with the first 5 wave decline (wave (i) or A) being wave C. This is because prior to that there is a 3 wave rise to a new high. A 3 wave rise to a new high and then decline in 5 waves is indicative of a flat correction. However I did label a very far fetched, yet plausible, alternate count for the 3 wave rise which would have it forming a major top (click here for chart from last Tuesday, or click here for full post from that day). As ugly and unlikely as this count seemed, it may hold true since we now have 2 impulsive declines sandwiching a non-impulsive rally. This is bearish. The million dollar question is, "at what degree is this top?" Too tough to tell at this point, but I did say a few times a couple weeks ago that I did feel that too many elliott wavers and analysts were calling for this monster crash that Prechter has been leading the charge for. And that the sell off of the century most likely wouldn't occur right when everyone expected it, right on time, and right on track with the short term wave count. I said it will do something to fool us, or have us give up. Well I know for a fact at this point a lot of extremely bearish people have given up on this most recent rally, and that the 3 wave rise to a new high and now two 5 wave declines is not textbook EWP at all. Could this be what I was saying about "fooling us"? We'll see. What does seem more certain though is that we have much lower levels to obtain before a bottom might be in place. If this is not the big wave [3] or C, then it's at least a moderately large A-B-C decline, which would have us finishing up wave i of C right now. If so, wave C should carry down to around 1155-1170, an area of prior congestion. If the market relentlessly continues to sell off right through this target area, and rallies continue to unfold in 3 wave moves, I'll then look to set targets that will help us determine if the current decline is in fact the big wave [3] or C.


NASDAQ 100 HEAD AND SHOULDERS


The Nasdaq 100 continues to fulfill the then speculative head and shoulders top I projected on Wednesday (click here for Wednesday's chart, or click here for that day's entire post). In addition to this, both of the Nasdaqs had their lowest daily close since April 12th, suggesting that the uptrend has halted, and the bears are now in control. The evidence is strong that continued selling throughout the overall market should resume in the coming days, if not weeks. The degree of that downtrend will be determined once the structure unfolds.


PLEASE NOTE: THIS IS JUST AN ANALYSIS BLOG AND IN NO WAY GUARANTEES OR IMPLIES ANY PROFIT OR GAIN. THE DATA HERE IS MERELY AN EXPRESSED OPINION. TRADE AT YOUR OWN RISK.

Thursday, April 29, 2010

Market Surges Higher, Degree of Trend Now Key


The market surged strongly higher right out of the gate this morning and continued the rest of the day in what appears to be a wave iii. Tomorrow it's likely to get some pullback or sideways action for wave iv which will eventually give way to another surge above today's highs in wave v. What's of importance here is at what degree of trend is this 5 wave rally? Is this 5 wave rally going to complete the larger wave 5 and end the rally that started early February? Or is the 5 wave rally just a wave 1 that still needs waves 2-3-4-5 to complete wave 5? I don't know yet. What will give us some clue though is whether or not wave v ends above this year's highs in the major indices. If wave v makes it above this years highs, then it's quite possible that will complete wave 5 and create a major top and reversal. If it doesn't make new highs on the year, then it's probably just a wave 1 within wave 5, and wave 5 has quite a bit further to go. Today's rally was quite strong with almost 80% NYSE volume to the upside, so we should have further to go on the upside regardless.

So again, the key to when a top should register is finding out what degree of trend we're in right now. If wave v rallies to new highs on the year, then it may mean wave 5 is complete and a large reversal will occur. If wave v does not make a new high on the year, then it's possible the 5 wave rally from yesterday's lows in the Dow (Tuesday in the S&P) is just a wave 1 within a larger wave 5 which means much more rallying in the coming weeks.


Above at the top is the Nasdaq 100 chart again, showing the possible head and shoulders top forming. Interesting that yesterday I said that the right shoulder could carry to the 2040 level before topping and reversing and that's right about where it halted at today (see yesterday's chart here). So if we get a sharp sell off tomorrow with an impulsive structure then I'll be putting this head and shoulders pattern on the forefront of my analysis, and view the alternate bearish S&P count just above as my primary count. A break below 1193 in the S&P cash index would be a strong sign that a top was in and these two bearish charts above are correct.

So the bearish counts are a close second place as far as determining the liklihood of structure unfolding now. If the NDX's head and shoulders pattern holds, and the S&P declines beneath 1193, I'd say that a larger top had already registered and that a big and lengthy selloff is underway.


PLEASE NOTE: THIS IS JUST AN ANALYSIS BLOG AND IN NO WAY GUARANTEES OR IMPLIES ANY PROFIT OR GAIN. THE DATA HERE IS MERELY AN EXPRESSED OPINION. TRADE AT YOUR OWN RISK.

Wednesday, April 28, 2010

Flat Correction Complete, the Market Should Move Higher

S&P Cash Daily


The flat correction discussed yesterday appears to be on track. Today the Dow made a slight new low while the S&P did not. So aside from a very small and minor bullish divergence between the two indices, the Dow's rally from its low appears more impulsive than the S&P.


Today's Bottom and Rally in the Dow


Here is a close up of the Dow's potential five wave rally today. It's far from convincing, I know. The S&P does not follow this structure because its low was put in yesterday, and the rise from that low is in 3 waves. So there's some conflicting behavior here between the two indices in the very short term. But the evidence does support a move higher to new highs on the year because the recent rally to new highs that I labeled wave 'b' in the first chart, is a 3 wave advance. A 3 wave move is corrective, and since it made a new high it probably means it's part of a flat correction. Since we did have a bounce all day today, a new low beneath today's would make the wave 'c' of the flat correction quite ugly, and therefore less likely. So a break of today's lows in the Dow at 10,965 and yesterday's S&P lows at 1181.62 would put the flat corrective scenario in doubt. If BOTH those lows are broken then I would become short term neutral; but as of right now, I'm short term bullish for one final wave 5 push before a larger and longer decline occurs.


Nasdaq 100 Possible Head and Shoulders Top Forming??


Above is a 30min chart of the Nasdaq 100 showing what might be a head and shoulders top forming. This is very speculative since there's really no evidence of the right shoulder being printed, let alone having a right shoulder topping. But it's something to look for. It's possible the S&P and/or Dow will make slight new highs and the NDX will fail to do so, creating the projected right shoulder and creating a bearish divergence between indices. So if the lows in the Dow and S&P mentioned above are not broken, and the rally continues the rest of this week, watching the Nasdaq 100's structure compared to the other indices will be interesting. We may be able to look at the 2040 area of the NDX as a possible topping point for this index since that marks the topping area of the left shoulder, and perhaps the entire market will be topping when it reaches that level too. Just a thought, and something to watch.


PLEASE NOTE: THIS IS JUST AN ANALYSIS BLOG AND IN NO WAY GUARANTEES OR IMPLIES ANY PROFIT OR GAIN. THE DATA HERE IS MERELY AN EXPRESSED OPINION. TRADE AT YOUR OWN RISK.

Tuesday, April 27, 2010

4th Wave Flat Finishing Up, then Higher

S&P Cash Index Flat Correction


Well I wish I didn't post anything yesterday because I was wrong across the board. I tried going long today on the stock market and was long the EUR/USD yesterday and was stopped out on both at the end of today's US session. For those of you who subscribe to EWI's Short Term Update, the above outlook is nothing new to you. With the ending diagonal and 4th wave triangle now eliminated with today's action, it leaves the high possibility for a flat correction for wave 4 as shown above. The structure is near perfect as the rally to a new high from the wave 'a' low was in 3 waves which is wave 'b', and then the ensuing wave 'c' decline today is composed of 5 waves. All this is a textbook EWI flat correction. What this means is that wave 'c' should bottom soon, if not already, and give way to more rallying to new highs for the year before topping. A break below 1165 tomorrow or Wednesday in the S&P cash should be enough erosion in support in fast enough time to suggest that a larger top was in and the flat correction is probably wrong if a new high on the year is not acheived first. So if we get a large rally tomorrow that does not make a new high on the year and then declines to beneath today's low in 5 waves, then that too would probably eliminate the flat correction and open up the door to a more bearish scenario.


Unlikely, but Possible, Bearish Count on the Nasdaq Composite


Okay, I'm almost embarrassed to post this but I feel I have to just to leave open the possibility that a large top was put in today. I've said here quite a few times that I feel "the top" will surprise everyone, including elliott wavers. "The top" will probably not unfold in perfect 3s and 5s patterns and make it easy for us to call the exact top print in the market. So with that in mind, I see the 3 wave rise to a new high and 5 wave decline today and it certainly gets my attention because most wavers will think that 3 wave rise is a corrective move within a flat correction (just like I do, as stated above), leaving elliott wavers vulnerable to missing the top and being "surprised". Unfortunately from an EWP perspective there's not much support to suggest "the top" is in. The best I can see right now is in the example of the Nasdaq Comp. shown above. It suggests that a 5 wave rally occurred into "the top" and the 5th wave was truncated. This is very unlikely with just the shape, size and time length of the 4th and truncated 5th, along with the apparent triangle for wave 4. But I wanted to throw this up here still, just to keep our eye on it if the S&P cash were to break below 1165 soon. Being on the alert for "surprises" to a market the top, it keeps my on guard.


PLEASE NOTE: THIS IS JUST AN ANALYSIS BLOG AND IN NO WAY GUARANTEES OR IMPLIES ANY PROFIT OR GAIN. THE DATA HERE IS MERELY AN EXPRESSED OPINION. TRADE AT YOUR OWN RISK.

Monday, April 26, 2010

Stock Market in Wave ii; EUR/USD Giving Good Bullish Opportunity

S&P Cash Index


The S&P appears to be in a wave ii correction as shown above. The behavior of the overall market is a bit suspect if it's in a wave (iii) as I have labeled. And what I mean by that is that the Dow was strong today while the S&P was substantially weaker, and this wave (iii) continues to get more and more sideways. If the market is in a wave (iii), I'd expect all major indices to be sharply moving higher in unison in a nice healthy rise with strong volume and internals. Nonetheless, it's still quite possible and it sets up a good bullish opportunity with a stop just below 1190. If the market continues on sideways without shooting higher like a wave iii of (iii) should, then I'll look at less bullish sideways moves that would fit into the current market behavior better. I don't see any reason evidence suggesting a top is in at this point, so shorting right now does not seem wise. If anything, I'd be looking to get long for a short term trade with a stop below 1190 if a good opportunity arises.


EUR/USD Daily


I haven't talked about currencies for a while because I haven't seen any good opportunities lately. But I do see one in the EUR/USD. Looking at the daily chart above we can see a clear 5 wave drop which has now resulted in some sideways action. A 4th wave triangle is ruled out because it just recently made a new low (what I labeled wave 'b'). But the 3 wave rise from 1.3266, then decline beneath the wave 5 low, tells me that a "flat" correction is probably unfolding. If correct, we should now be in a 5 wave impulse rally for wave C. Wave C's of flat corrections normally go just above wave 'a', but since wave 4 is so close by, and it would fit EWP's "right look" better with a bigger and longer correction, I think the wave C rally should carry just above 1.3817. So I'm long the EUR/USD from current levels with a small position and will add to it if it falls lower. My stop level is at 1.3197. So right now I'm risking 188 pips to make a possible 432 pips.


PLEASE NOTE: THIS IS JUST AN ANALYSIS BLOG AND IN NO WAY GUARANTEES OR IMPLIES ANY PROFIT OR GAIN. THE DATA HERE IS MERELY AN EXPRESSED OPINION. TRADE AT YOUR OWN RISK.

Sunday, April 25, 2010

Market Continues its Push Higher


The market continued to push higher as the evidence Thursday presented. The bullish count I have is very aggressive at these overbought levels but I'm going to start with a very bullish account, and then downgrade it as the market movement and structure requires. The current count will allow for wave ii pullback soon but will lead to a wave iii of (iii) of 3 higher, which will have to a sharp big strong rally. So if the market doesn't rage higher after that wave ii, I know I'll have to restructure the count. There's also the possibility of a large 4th wave triangle unfolding, or an ending diagonal for a 5th wave right now. But these seem a bit too large and time consuming at this point, and I think it's a bit too early to start looking for a triangle or diagonal at this piont. Once the market starts going more sideways without a 3rd wave sharp rally move occurring, then we can focus more on the triangle and diagonal structures.

So that's it for now. The market's larger trend appears to be up, but the overbought and jubilent mood right now warn that the higher it goes, the faster and larger the ensuing decline will be. When I think I have an idea that a top might be forming, I'll post it here.


PLEASE NOTE: THIS IS JUST AN ANALYSIS BLOG AND IN NO WAY GUARANTEES OR IMPLIES ANY PROFIT OR GAIN. THE DATA HERE IS MERELY AN EXPRESSED OPINION. TRADE AT YOUR OWN RISK.

Thursday, April 22, 2010

Market Extended Correction Lower, Then Continues Uptrend

S&P Candlesticks


The market extended its correction lower this morning to complete the WXY double zig-zag correction I mentioned yesterday, then it proceeded with its larger uptrend with a huge surge higher this afternoon. Today's action creates yet another bullish candlestick on the daily chart as you can see in the above S&P chart. The bulls are in full control as any sell off in the past week has been stopped by the bulls and pushed higher. You can see this by the long wicks on the underside of the candlesticks in the above chart. It shows a lot of bullish support around the 1190-1200 level in the S&P. The bulls are still in control. For this bullish indicator to be invalidated, and to possibly signal a reversal in trend to the downside, I'd need to see a close beneath 1184. Until then, this candlestick pattern paints a bullish picture.


S&P Cash Wave Count on 5min Chart


The above wave count is not ideal, but inside a larger correction wave counts aren't often ideal anyway. Today we completed wave Y of a WXY double zig-zag correction that I have tentatively labeled a larger wave 2. We are now in wave 3 which means lots of bullish pressure much higher from current levels. Without aggressive buying tomorrow and early next week, it will call this wave count into question. But with declines falling in 3 wave segments and rallies unfolding in 5 wave segments, the larger trend appears to still be up. I don't feel this small correction this week was enough to fully alleviate the overbought condition of this market, so I doubt I'll get long anytime soon. A new high on the year probably just means the most recent rally is just extending a bit higher. A new high on the year in the S&P will stop my short position out and put me back to neutral, but I'll still be on high alert for signs of a reversal to get back in short.


PLEASE NOTE: THIS IS JUST AN ANALYSIS BLOG AND IN NO WAY GUARANTEES OR IMPLIES ANY PROFIT OR GAIN. THE DATA HERE IS MERELY AN EXPRESSED OPINION. TRADE AT YOUR OWN RISK.

Wednesday, April 21, 2010

Stock Market Looking Bullish


Unfortunately the market has not wanted to fall and appears to still be in "bull mode". Notice the above 5min S&P cash chart. We have a nice 5 wave rally followed by 2 three-wave declines I labeled as a WXY combination correction. Going up in 5 and then declining in 3s is basic EWP stuff and suggests the larger trend is up. There are a series of lower lows and highs that have formed so until that trend is broken the bears can hope for the best. But the evidence right now suggests further rallying ahead of us. If the 5 wave move is correct, then it's probably a wave 1 and we're about to see a very strong wave 3 up anytime now. So if I see strong internals and volume along with price strength tomorrow, I might be inclined to jump on the long side for a short term trade. But we'll have to wait and see how the market reacts.

So we're basically at a fork in the road where the next big move in the market should tell us where the larger trend is going and I can jump on board with a position accordingly. Right now, the evidence supports the bullish case with the 5 wave rise and 3 wave declines following it, but the risk/reward favors the bears at this point. I'm currently still short but will stop out when the S&P makes a new high. When that happens, I'll look at the internals of the market, if they're solid then I might take a long position.


PLEASE NOTE: THIS IS JUST AN ANALYSIS BLOG AND IN NO WAY GUARANTEES OR IMPLIES ANY PROFIT OR GAIN. THE DATA HERE IS MERELY AN EXPRESSED OPINION. TRADE AT YOUR OWN RISK.

Tuesday, April 20, 2010

Market Running Out of Room to Rally


Well I thought we had a small completed 5 wave rally at yesterday's close, suggesting we'd have an ABC zig-zag correction higher where waves A and C would be composed of 5 waves advances. So yesterday I thought that 5 wave advance was wave A. That was clearly not the case as the market just charged higher all day today with strong internals and volume. The bears were non-existent. So it was a good day for the bulls. But one strong day doesn't mean the bull run is on now for the next several weeks as tomorrow can easily reverse all the bullish action today. But it needs to do it quick because we're running out of room to the upside here to still consider this count correct. Yesterday I said the Dow completed 3 waves down, suggesting its drop was just a correction and that a new high might be in the cards. The Dow is almost there. But the other indices still sport the 5 wave drops so I'm not sure a new Dow high will be followed by the other indices. What is concerning though is that the rally from yesterday into today looks a lot like a 5 wave advance, and Apple earnings are getting everyone excited again, so it seems likely this market will continue higher early tomorrow morning. But, until the S&P makes a new high on the year, the other bearish evidence remains in place and sets this market up for further losses.

With the action today creating a 5 wave rally, my confidence in the short term bearish case has waned significantly, but it will take a new high on the year in the S&P to ultimately destroy the short term bearish outlook completely.


PLEASE NOTE: THIS IS JUST AN ANALYSIS BLOG AND IN NO WAY GUARANTEES OR IMPLIES ANY PROFIT OR GAIN. THE DATA HERE IS MERELY AN EXPRESSED OPINION. TRADE AT YOUR OWN RISK.

Monday, April 19, 2010

Market Correcting in a Wave [ii]

S&P Cash Index Wave Count


The S&P and Nasdaqs charged to new lows today making nice 5 wave declines In the S&P, the 4th and 5th waves are tough to label, but the ugly triangle I have above is a good start for now. Today the NYSE had more decliners than advancers and just a bit more volume to the upside than downside with the Nasdaqs and Russell 2000 small cap indices struggling despite the Dow's strength. So it was quite a lopsided unhealthy rally from the lows and not an across the board bullish run higher; something we'd see in a correction, not the start of a fresh new bullish surge. Looking at the above S&P chart, it's possible that wave [ii] ended this afternoon since it rallied to a common retracement level just above the previous wave 4. But it's quite sharp and looks like a 5 wave move, suggesting that it needs to subdivide further and higher before it tops in wave [ii] and reverses. Also, the action in the Dow also suggests further upside.


Dow's Bullish Non-Confirmation


An element of caution is warranted for the over-aggressive bears since the Dow has been resilient to the decline so far, and especially was quite strong today. It did not make a new low for a 5th wave like the Nasdaqs, S&P and Russell did. This leaves a 3 wave decline for the Dow. Now the weak internals today make me think the Dow is not leading the market higher at all and that people are just fleeing to higher risk assets and putting them into the solid blue chip companies in the Dow for protection; hence the reason the high risk Nasdaq Composite and Russell closed down today despite the Dow's strong showing. So it's possible that the Dow may eek out another high while all the other major indices do not, and then the market reverses lower for the S&P's wave [iii]. Right now, that's my best guess at this point. My current short positions will stop out if the S&P makes a new high on the year, but if it does, I'll have my finger on the trigger to re-short real quick on the next signs of a top because just a two day mild drop is not enough to alleviate this massively overbought condition we're in right now. So I'm short term bearish as long as the S&P's highs on the year remain intact, and know that my gut will be tested in the short term as the Dow's telling us the market will rally further in the very short term.


PLEASE NOTE: THIS IS JUST AN ANALYSIS BLOG AND IN NO WAY GUARANTEES OR IMPLIES ANY PROFIT OR GAIN. THE DATA HERE IS MERELY AN EXPRESSED OPINION. TRADE AT YOUR OWN RISK.

Friday, April 16, 2010

Stock Market Registers AT LEAST a Short Term Top

S&P 500 Cash Index Short Term Wave Count


Today the market finally ran out of gas. After showing extremes in various indicators, the market sold off hard today. Although it closed off its lows, the bulls were unable to regain control and push the market significantly higher into the close. The late day rally also fits well into the S&P's wave count as a 4th wave, so we should see some continuation to the downside on Monday. The S&P is sporting the best short term wave structure from what I can see at this point, so I'm charting my count there for now. If we can break today's lows real early on Monday, it will give us a real nice 5 wave drop from the highs, and allow me to get aggressively short on the ensuing corrective rally since the larger trend would clearly be down. So I'm looking for a quick continuation downward on Monday, followed by a corrective rally that will top and reverse before exceeding yesterday's highs.


Dow and S&P Divergences


So yesterday I pointed out that the Dow made a new high while the S&P did not. You can see what I was talking about in the above charts with the first set of blue lines. You can see that it led to a big selloff today. Although divergences between these two indices doesn't always result in reversals, it's good to pay attention to them as they often offer good early warning signs. Also notice that at the end of the day today we had another divergence with the Dow making a new high and the S&P not doing so. Will this lead to the same result as it did before? a selloff? I think so. The wave count is incomplete as shown earlier, and with the divergence shown in these two indices late in the day, the evidence points toward lower levels early Monday.


NYSE Internals


Today's selloff was done with conviction as you can see from the above NYSE internal data. 92% of its volume today was to the downside, and decliners outpaced advancers 4.32 to 1. So the bears had the upper hand today as the bulls stayed on the sidelines. I'm not going to get into total volume today because it was options expiration and that will skew the numbers a bit.


Goldman Sachs - OUCH!


The big news story today was about cream of the crop firm, Goldman Sachs, being charged with fraud by the SEC. I'm sure lots of politics are behind this, but whatever the motivation is, it was a surprise to the market. Just look at Goldman's daily chart above. It's ugly.


SUMMARY


So it appears the long long awaited short term top and reversal has registered. With one more shot down on Monday to break today's lows, we'll have a nice 5 wave decline from the highs this week. Because of that, we will know that the larger trend is down, and that any large rally is a correction and should be sold. Only a break above yesterday's highs would negate the short term bearish view. My initial target for the decline is still the 1171 area in the S&P, but judging by the structure and behavior of the decline, my targets may become much much lower.


PLEASE NOTE: THIS IS JUST AN ANALYSIS BLOG AND IN NO WAY GUARANTEES OR IMPLIES ANY PROFIT OR GAIN. THE DATA HERE IS MERELY AN EXPRESSED OPINION. TRADE AT YOUR OWN RISK.

Brief EUR/USD and Stock Market Update


On Monday I mentioned that the EUR/USD had a gap left from Sunday's open that should be filled at a bout a 100 pip profit from the current levels (click here for original chart). Today, the EUR/USD closed that gap so I'm lowering my stop loss to 1.3566. I have no real grasp of the larger trend and it's possible 5 waves down from the November 2009 high has completed, so I don't want to be too aggressive or greedy on this trade. So I'll keep lowering my stop as this pair treads lower until eventually I get stopped out at a profit.


As for the stock market, we have a nice sell off right now with the Dow down over 100 points. We've seen these occur several times in the past few months where the sell offs are bought up later in the day. If we can maintain the losses, or even accelerate lower, it would be very encouraging for the bears (correction: replaced "bulls" with "bears" here). A strong rally as the day wears on and into the close would put us back at square one in looking for signs of a top.


PLEASE NOTE: THIS IS JUST AN ANALYSIS BLOG AND IN NO WAY GUARANTEES OR IMPLIES ANY PROFIT OR GAIN. THE DATA HERE IS MERELY AN EXPRESSED OPINION. TRADE AT YOUR OWN RISK.

Thursday, April 15, 2010

Market Finishing up Subdivisions Before Topping; Prechter on CNBC's Fast Money


The Dow made a new high today but the S&P did not. So it's possible we'll get some pullback tomorrow if this divergence holds. When the S&P makes a new high with the Dow, then this divergence is erased and we will continue to count the unfolding subdivisions higher into a top. With options expiration tomorrow, I expect to see repositioning and some volatility take place. The Dow and S&P appear to be unfolding in slightly different wave structures right now, but should reconcile these differences as they both move into a top. The constant continuation of the rally into further overbought territory only strengthens my bearish position, and any sharp rally higher will only lead to me adding to my shorts. Once I can confirm a top with high confidence, I will get aggressively short at that point. So it's a waiting game from here.

Bob Prechter on CNBC's Fast Money (given about 45 seconds to speak, and then was forced to listen to screaming bulls talk over him. Enjoy the 45 seconds.)


Thanks to blog reader Jimbo for posting this video because I would have missed it otherwise. I used to watch FastMoney (FM) everyday when Ratigan and Mackey were on, but now the show is crap in my view with perma bulls doing cartwheels all day on the show.

(below are just a copy of the comments I left in response to Jimbo's post)

This is unusual for Prechter to go on here because he's said many times he doesn't like getting into shouting matches with people so he usually only does interviews if he's the only one on. Perhaps his subscriptions have tapered off a bit so he's spreading his wings into areas he normally doesn't go into.

And I'm actually glad those guys on FM are laughing at him and blowing him off because that only strengthens his case in my view. The FM crew preaches to the mainstream masses, and if they were scared or on board with Prechter, that would be concerning. But their blind optimism and dismissal of Prechter's caution is encouraging for the bears. I watched FM the past few years and no one was calling for a major top and decline and most of the time they spent the whole show talking about stocks to buy as the market descended lower. Big bears Fleckenstein, Nourial Roubini and Doug Cass always get a lot of crap from the FM crew. During the last big decline, some of the FM crew were bearish and expressed caution here and there in the short term, but no one on that show prepared us for the magnitude of what 2007-2009 gave us, NO ONE did. But Prechter did give us the play by play on it from start to finish. Prechter should have asked them where the fu$@ they were in October 2007 when people should have been extra cautious, not throwing "Fast Money" at their buy recommendations? Why doesn't the Fast Money crew run down the list of stocks they recommended to the public to buy during that time and compare them to Prechter's recommendations? FM missed the last top, so I don't expect FM to give us the scoop on a major top this time around either.


PLEASE NOTE: THIS IS JUST AN ANALYSIS BLOG AND IN NO WAY GUARANTEES OR IMPLIES ANY PROFIT OR GAIN. THE DATA HERE IS MERELY AN EXPRESSED OPINION. TRADE AT YOUR OWN RISK.

Wednesday, April 14, 2010

S&P Made 3 Waves up, Probably has Further to Rally, then Perhaps a Major Top

S&P Cash Index


So the S&P didn't read my post yesterday to know that it was overbought and should fall soon. But that's okay, I'm not offended. The extension and strength of the rally suggest it's a wave iii instead of a wave v that I suggested yesterday. This allows for another down-up sequence before a top. With options expiration coming this Friday, it shouldn't be difficult for us to accomplish that.


MACD Histogram


Above is a daily chart of the S&P cash index with the MACD histogram. The histogram shows us the divergence between the moving averages it charts (not shown). So a healthy and strong uptrend should be accompanied by the histogram increasing as well, which would indicate the moving averages are trending strongly upward. When the histogram moves in the opposite direction as price, it MAY signal an exhausting trend. In the above chart you can see that since March, price has charged aggressively higher while the histogram has declined and now gone flat. So momentum behind the push higher has waned. Now this is not a timing indicator since it can continue to exhibit this diverging behavior for a long time, but when I see stuff like this I know it's a bit late to jump on with the uptrend and that I should be looking to get short.


RSI


Above is a daily chart showing the RSI, another momentum indicator. Here you'll notice that the RSI is well into overbought territory and is the highest it's been for the entire rally from March 2009's lows. Again, this is not a timing indicator, but it does let us know when momentum is running out, or in this case, extended.

I can go on and on with these momentum indicators and fibo retracement levels and other stuff, but we've been grinding out these indicators for several months only to be faked out time and time again. The market will roll over when it's ready. The key for me is to stay mentally focused and disciplined to keep my eye on the target, and that's for a very large wave [3] or C decline to occur soon. Once it gets rolling, we'll know, and we can then make sound decisions to increase our profit potential. Patience is key.

Three things stand out to me currently that now have my attention at looking for a larger top than previously expected:

1) The RSI is at such a high extreme that it leaves the implication that perhaps this upcoming top will be larger than what I've been expecting. The extreme overbought nature of this market is astounding, and may lead to just as an astounding decline.

2) I have three friends that have retirement accounts that they manage themselves but they are far from economic or finance savvy at all. They missed most of the entire decline in 2007-2009, but have been cashing in on the big rally from the March 2009 lows. They know my very bearish long term position, along with Prechter's, for a major top and they know that I've been wrong as well recently. But today was the first day that all three of them boasted to me about how financially savvy they are, and how much money they've made on this rally, and then preached to me about how to trade the markets, and laughed about how wrong I've been for a "major top". For non-financially savvy folks like this to be boasting about how financially savvy they are and then rub in my face how right they've been screams at me that this rally from the March 2009 lows is in its latter stages. Optimism, even at the micro-levels, is at a real extreme. Pay attention to it.

3) And lastly, let's not forget the reliable VIX indicator. Yesterday the VIX confirmed the sell signal which means sometime in the next few days we should have a top and reversal. Considering all the momentum and sentiment extremes that exist at the moment, it's quite possible that a much larger top may be forming than originally expected.

We've been faked out several times for "the top" to register in the past, but that doesn't mean we should ignore signs of a major top being in from now on. Again we are approaching what appears to be a major turn in the market to the downside. We don't have to catch the absolute top tick, there should be plenty of time to make a well thought out disciplined approach to maximizing profits if "the top" does occur.

Let's see what happens in the next 1-4 days.


PLEASE NOTE: THIS IS JUST AN ANALYSIS BLOG AND IN NO WAY GUARANTEES OR IMPLIES ANY PROFIT OR GAIN. THE DATA HERE IS MERELY AN EXPRESSED OPINION. TRADE AT YOUR OWN RISK.

Tuesday, April 13, 2010

S&P Did Not Confirm New Highs of Other Indices Today; VIX Issues Sell Signal


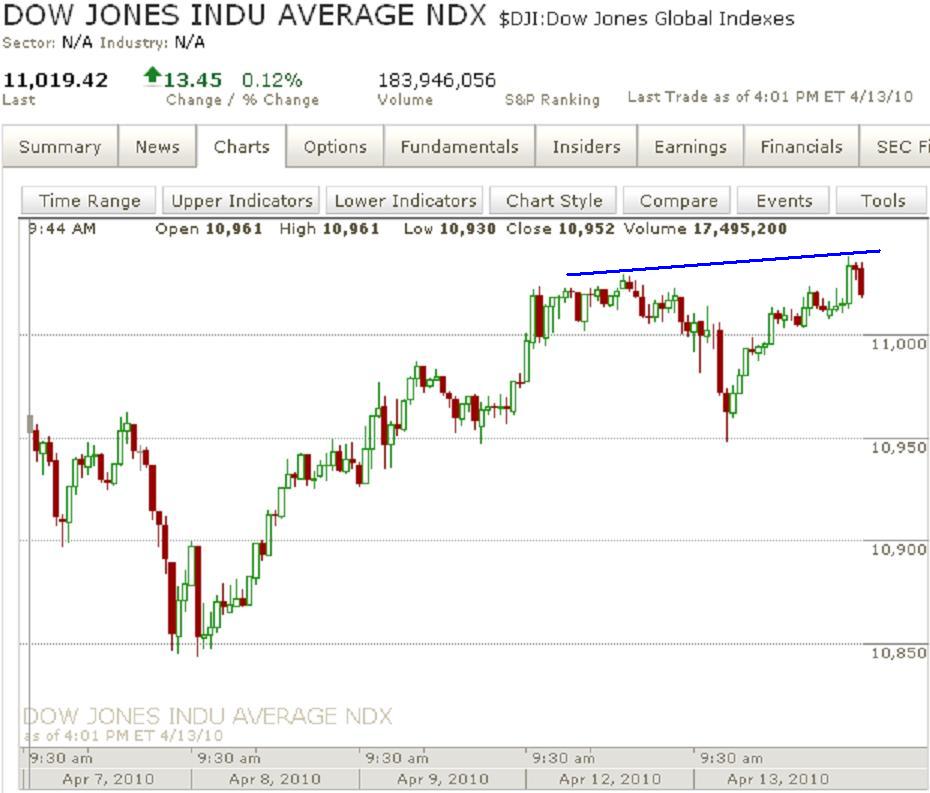
The wave count for the short term I posted yesterday does not appear valid anymore due to the depth of the correction that continued into today. Right now I'm not sure what the short term count is, but it appears to be part of a 5th wave, or maybe a "b" wave within a 4th wave flat correction. There are two things of note that occurred today, and both have bearish implications. The first is that the Dow and Nasdaqs all made new highs today but the S&P did not. Oftentimes this divergence will occur right before larger turns in the market. So we'll see if this holds true with a sell off tomorrow. Second, despite the market closing up today, the VIX also closed up and above the lower bollinger band which gives us a nice sell signal. With options expiration this Friday, we could be in for a wild ride, and the evidence points to the ride being to the downside. The market seems poised to turn lower at any moment.

The EUR/USD has not closed the gap from Sunday yet so I'm still holding short that pair in anticipation that it will be filled soon, and perhaps continue lower from there with the stock market's decline.


PLEASE NOTE: THIS IS JUST AN ANALYSIS BLOG AND IN NO WAY GUARANTEES OR IMPLIES ANY PROFIT OR GAIN. THE DATA HERE IS MERELY AN EXPRESSED OPINION. TRADE AT YOUR OWN RISK.

StatCounter