Friday, December 5, 2008

Market Should Collapse Early Monday Morning; Dec. 5, 2009


After reviewing the charts and indicators it's hard to get past the strength of the rally today and breaking to a new high. However there are two corrective waves that can account for the strength of the move today, and they are waves C and 2. Both are very strong and both result immediately in a strong reversal to new lows. It's possible today's rally was just a wave C of a 2 wave. However as you can see from the above chart, the correction is quite elongated compared to the intial five wave drop making this wave count ugly. What's good to know is that the market is currently near the beginning of that 5 wave drop, and if it rallies above that next week then we know we have much more rallying to go. But as long as the market trades below that level, it's immediately bearish. The above chart is very busy, I know, but it is what it is. One thing I did notice on the bigger time frame chart is that despite today's huge rally on solid up volume, the NYSE advance decline ratio still failed to come close to making a new high. Plus, two things that have been trading in line with the stock market were down today, i.e. gold and the euro against the dollar. Both look to be immediately bearish and have heavy selling ahead. So this may signal heavy selling for the stock market too.

If the wave count above is correct, it means a wave 3 at multiple degrees should get underway immediately Monday morning which means a straight line down right out of the gate. So if that were to occur, I expect to see the futures down big on Sunday or early Monday morning. So watch for some big news event this weekend possibly to trigger that.

To sum it up, the market's nice short term bearish pattern has been rocked, but not destroyed. As long as the indices stay below last week's highs, the market is immediately bearish.

Caution Warranted; Dec. 5, 2008


The rally this afternoon has carried much further than I anticipated, and up volume and expanding breadth (see above chart) warn that this MAY be the beginning of a major rally phase. The Nasdaq 100 was showing the clearest elliott wave pattern and it has made a new high this afternoon (see above chart), negating that second 5 wave drop I labeled. The larger trend is still down, but due to the recent strength of the rally making new highs, caution is warranted. I covered some short positions at break even and bought some call options for protection. My bias is still short, but because I'm not sure what the very short term market structure is, I'm moving to a little more conservative. Regardless of what happens the rest of the day, this afternoon's rally calls for a reduction of risk.......for now.

Sell Off to New Lows on the Year is Underway; Dec. 5, 2008


With the contracting breadth, impulsive (5 wave) declines, choppy weak rallies, and now break of the ascending trendline, we can be confident that the next declining phase in this bear market is underway to new lows on the year (below 741 in the S&P).

Above is a 15min charts of the Nasdaq 100 showing the clean strong break of the ascending trendline, and with this morning's decline it created another nice 5 wave drop. So according to Elliott Wave Principle, the trend is now down. My target is for new lows on the year to be achieved farely quickly which will bring the S&P below 741.

I am fully short the S&P and Nasdaq 100, along with gold. I have no long positions right now.

Thursday, December 4, 2008

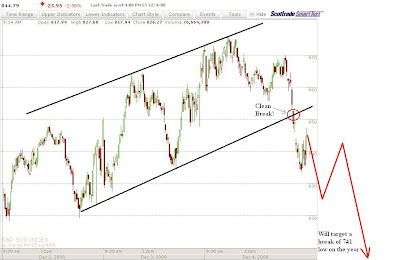
Clear Break of Short Term Trend Line Signals Big Losses Ahead; Dec. 4, 2009


There are several indicators I look at every day to try and understand the health of the market. I don't talk about all of them every day because then I'd spend all day making charts and writing. We saw that yesterday's chart showing contracting advancers/decliners on the NYSE while price was rising was a good indicator that the rally was waning and a sell off was coming (see "CRAZY MARKET" post below). That sell off finally happened today around noon PST.

Above is another chart that I was watching because of the channel that formed for the rally this week. You can see a nice parallel ascending trend channel shown with the black lines. I basically decided that whichever way the market brokeout to, was the way the market would strongly take us in the near term. As you can see on the chart above, the market broke cleanly and strongly to the downside which tells us that the market's near term trend is down, and much lower levels are soon to come. Usually when a market breaks a trendline it will rally up to touch the underside of the trendline and then reverse downward again. So it's possible we'll see a rally overnight in the futures, or early in tomorrow's session and then a very very sharp reversal to the downside. As long as the market doesn't break through the underside of the trendline and trade back inside the trend channel again, the short term trend is down. And it should move in a hurry.

I'm holding short, with no long positions. If my analysis is right, tomorrow and next week should be heavy selling taking us to new lows on the year (S&P below 741).

Possible Short Term Bullish Potential; Dec. 4, 2009


*** Please look at my prior post below to get a look at the bigger picture so we don't lose focus on where we're at in this bear market.

With the constant horrible news coming out this week, and the futures down every morning and yet Tues., Wed., and Thurs., all rallying into the positive once the cash market opens, it's apparent this market wants to push higher. So I want to look at a very viable bullish alternate scenario. As seen by the chart above, we might be in the early stages of a very long and strong wave C. The reason I don't like this scenario is because the rally so far is very choppy, not impulsive, and all the internals are very very weak and getting weaker. But all that can change with on huge surge across the board. But as for now, this just seems unlikely the way the market is trading internally and technically. But until we get a huge down move, this is a possibility, so I will keep my eye out for this possibility.

Long Term Big Picture; Dec. 4, 2009


I think it's good from time to time to post the big picture so we don't lose sight of what's going on-on a large scale. The chart above is a daily chart of the S&P. I labeled the chart assuming that we will soon rally sharply in a wave (4). You can see that once that's complete, we will fall to new lows for 2008 in a wave (5). Once that occurs, the entire decline since last year will be wave [1] in a 5 wave cycle. So a major multi-month strong rally will occur in wave [2], which I feel will be due to the euphoria of the Obama presidency beginning. This wave [2] is one we don't want to get caught short in, and we definitely want to be long during this rally.

Wednesday, December 3, 2008

Crazy Market; Dec. 3, 2009


Well the market continues to be extremely volatile and choppy. The choppiness and inability to go above that key level in the Nasdaq 100 as mentioned in prior posts tells me this rally phase is just a correction. However I'm not certain as to what exactly is going on, I only know that the larger trend is down so rallies should be shorted and declines should be used as an opportunity to take profits.

Above I placed a 15min chart of the S&P with the NYSE advancers/decliners indicator at the bottom (purple line). The higher the NYSE indicator, the more advancers there are vs. decliners. Many times we can identify the strength of a move and/or when it's ending by this indicator because it shows us the demand for stocks. So let's look at the chart and go over it:

Notices that I circled the highs on the NYSE indicator and the corresponding highs on the price chart above it. The first set we see "Highest High" on both price and the NYSE. That level marked the strongest NYSE breadth during this period. Then notice the next circle it's "Lower" while price was "Higher" in red. So price made a new significant high, yet NYSE breadth actually contracted during this tiem, telling us that-that big rally was weakening. Shortly after this occured, we had a 9% sell off in one day. So it proved to be a good indicator of a weakening rally.

Now let's look at Tuesday and Wednessday's data. We see the "Highest Highs" again in black. Then notice that all of the following "Higher" highs in price are accompanied by "Lower" lows in the NYSE breadth indicator below. So the market is rallying but breadth is contracting. It seems that buying demaind is severely waning and this rally is weakening severely. Last time this happened we saw a 9% sell off in a day. As long as this trend continues, this market is about to sell off.

Wave C Rally, Then Sell Off; Dec. 3, 2009


Above is an updated 15min Nasdaq 100 chart. So far the projection is playing out as expected (see chart from prior post). It appears a wave c rally is underway and when it exhausts, it will be met with heavy selling pressure to new lows on the week. As long as a new high from last week (see horizontal line on chart above) is not exceeded, the short term trend is down and rallies should be sold in my view. I've already shorted at the high yesterday and shorted again when the Dow rallied over 120 this morning.

I'm selling big rallies and closing positions at profits on sell offs. That's my theme until the medium term picture clears up.

Tuesday, December 2, 2008

After Correction, Another Sell Off; Dec. 2, 2008


Well if an A-B-C correction is taking place, like projected in my chart below, then the wave B went much deeper than expected. But that's ok, it could be a "flat correction". This means a slight new high above wave A and then the market will roll over to new lows on the week.

I posted a 15min chart of the Nasdaq 100. It tends to be a good leading indicator of what's going on the overall market. This index is the only one that traced out a clear 5 wave drop yesterday (see above chart). With that huge selling pressure yesterday, I expect some follow through soon. We didn't get it today, and the choppy nature of the rally today tells me this is just a correction, and the continuation of selling pressure should resume soon, like sometime tomorrow.

As long as the Nasdaq 100 stays below the beginning of wave 1 (see red horizontal line on chart above), then the market is short term bearish.

Correction Underway; Dec. 2, 2008


With the very strong decline yesterday and momentum and candlestick indicators pointing to lower levels, I expect to see some follow-through soon. Today's correction has already traced out what appears to be a 5 wave rally (see above chart), so after a brief correction it's possible another rally will occur to complete the whole correction. This correction today is healthy for the downward move. The market dropped 9% yesterday and if it immediately continued this morning it would reach an oversold level and I'd close most or all of my short positions. The fact that it's rallying and alleviating the downward pressure probably means a bigger drop will come soon, probably well below 800 in the S&P.

Monday, December 1, 2008

Wow! Only One S&P Stock Closed up Today; Dec. 1, 2008


Well the bearish divergence I spoke of in prior posts finally had an impact on the market today with the S&P shedding almost 9% today. When the market rallies that much that fast and is accompanied by a divergence of momentum indicators it almost surely results in a snap-back in the opposite direction. A healthy bull market would move up gradually with minor bumps along the way; not 18% in 5 trading days.

Today's decline was extremely ferocious, almost like some type of 3rd wave. Out of the S&P's 500 stocks, only 1 stock closed up on the day. I've never seen that before. Also, 98.6% of NYSE volume was to the downside. So today, everybody sold everything. It makes it a possibility that some other more bearish wave count is unfolding that I'm not seeing and the market will head to new lows on the year very soon. Tomorrow will be very important in determining that. Another day tomorrow with big declines and very weak breadth all the way into the close could mean that the market is falling much further and sooner than expected. And as you can see on the above chart updated from this morning, as of the close today we have a nice strong bearish candlestick formation and the stochastics have crossed down. So the very bearish scenario is a possibility. We should see follow through to the downside tomorrow, and possibly most of the week.

The market structure and short term trend is a bit unclear right now from an elliott wave perspective, but we know the larger trend is still down, so I'm holding the core of my short positions until at least 800 in the S&P is hit, depending on the internals when that happens. I closed about 25% of my short positions today and all my call options early this morning as well.

The Next Decline Phase is Underway; Dec. 1, 2008


The decline phase I've been waiting for is underway. And as usual, it doesn't happen exactly when I expected it to. This is another reason why I like to ease into positions. I've been shorting this entire rally on the way up and this morning I closed the remainder of my protective call options at a small profit.

The reason I feel this is the next declining phase that should take the S&P to at least 800 is because we finally have the sellers back in the market. NYSE breadth is very weak and out of all 500 S&P stocks only 7 or trading up today.....yes, 7! That's a broad market selloff. Once again, the beginning of a new month brings about heavy selling. This accompanied with Black Friday's retail sales out of the way, and the horrible manufacturing and construction numbers are contributing to the sell off. This decline feels the it's the real deal because unlike previous declines the past two weeks, this one is accompanied with a 5% sell off in gold, and the euro is selling off, and the yen is rallying strong across the board. All these are signs of a broad market selloff that should have enough strength and momentum to reach my target area of 800 in the S&P. And quite possibly much further.

As for the technicals; in the S&P daily chart above you can see a big red bearish candlestick forming after smaller green ones from the week prior. This is a weakening structure as long as we close down big today. Also, look at the stochastics at the bottom (circled), they are about to cross down. A strong close down today should make those cross down and confirm that momentum is now turned down.

Sunday, November 30, 2008

Looking for Positive News This Week; Nov. 30, 2008

One more note before we go into this week. I'm looking for a lot of positive news this week, whatever it may be. We should see nothing but optimism pour from analysts on the financial news and a sense of complacency and euphoria hit us this week. Once that occurs, the market will be primed to start it's decline. So expect great news to come out tonight, Monday, and perhaps Tuesday which will send the market higher. But by the end of the week, the market should rollover and enter a multi-day/week declining phase.

StatCounter