Friday, July 16, 2010

We've Seen this Structure Before


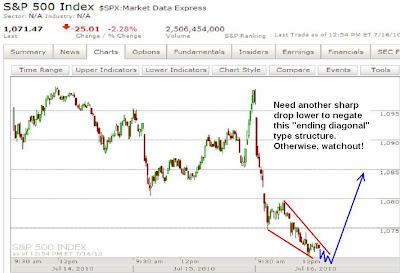
I need to come up with a name for this structure since I've seen it so many times. It's a sharp drop followed by a little or no rally, then just a choppy grind lower. This usually leads to a very sharp rally and eventually to new highs. It's a corrective structure. Although this outlook will be negated if we instead get a sharp drop lower again. But as long as that choppy grinding mess lower exists, beware of a sharp snap back rally.


PLEASE NOTE: THIS IS JUST AN ANALYSIS BLOG AND IN NO WAY GUARANTEES OR IMPLIES ANY PROFIT OR GAIN. THE DATA HERE IS MERELY AN EXPRESSED OPINION. TRADE AT YOUR OWN RISK.

Strong Selloff on Options Expiration Day


The economic data continues to reverse and disappoint with consumer sentiment dropping much more than expected, and banks are selling off after earnings reports as many investors are concerned about the amount of loan availability in the economy and the fact that a lot of earnings was generated through tapping into reserves. The internals of the selloff this morning are very bearish with only 10 stocks in the S&P trading up, and 94.5% of volume on the NYSE on the sell side. Volume is big but it's options expiration day so we can't read too much into that.


As for the wave count, from an objective viewpoint, looking at the short term here it definitely looks like a corrective setback from the highs of the week. The waves are very choppy and composed of 3 wave moves. So I'm still expecting this to be an X wave of a triple combination. That means one more 3 wave rise for wave Z and then wave (ii) will be complete.


The very bearish internals, failure of the S&P at the 1100 level, the break-away gap this morning, and the sharp nature of today's decline after yesterday's big rally into the close has me looking at an immediate bearish option. I looked at the Nasdaqs and other indices and it's really tough to get a good 5 wave decline from the high that I'm confident in. And I'm already trying to shove a square peg into a round hole with the above count, but I do want to be aware that wave (iii) MIGHT have started today.

Going around the EWP forums and blogs it's obvious that everyone is on the lookout for the next be wave 3 down, so I know that it's likely the market will again do something to fool us at the highs to keep the elliott waver masses hesitant. Perhaps this current structure is it. The fact that the market subdivided in 3 waves from the high and then failed to make a new high in a sharp spike that was completely reversed the next day perhaps is the market's way of "fooling" us. If so, wave (ii) completed yesterday with a "truncated 5th wave" (failed 5th wave). This means that wave (iii) is underway now and should be composed of extremely heavy selling to well below 1000 in the S&P before bottoming. If this is the case, then we should have little patience for the market to flip flop around sideways or undergo long time consuming deep rallies; in my opinion. The market should be headed very firmly down if this count is to take precedence. Otherwise, I'm counting today's decline as part of an X wave with new highs still to come.

Also, I mentioned a week or so ago that the precious metals uptrend appeared broken. Well today silver has sold off sharply again today, and all while the euro has been surging higher. Also the USD/JPY (US dollar vs. the Japanese yen) has sold off sharply as well. This suggests that risk aversion is coming back to the markets. And that doesn't bode well for equities going into next week.


PLEASE NOTE: THIS IS JUST AN ANALYSIS BLOG AND IN NO WAY GUARANTEES OR IMPLIES ANY PROFIT OR GAIN. THE DATA HERE IS MERELY AN EXPRESSED OPINION. TRADE AT YOUR OWN RISK.

Thursday, July 15, 2010

Market Corrected Today; But Far too Brief to Alleviate the Severe Overbought Condition Achieved From the July 1st Low


So the S&P broke below the 1090 level with ease this morning, suggesting that at least a correction was underway and that the short side should be played. But just as quick and easily as that level was broken, it was regained in the last 30 minutes of trading. The decline was far to quick and shallow for the market to fully correct the rally from the July 1st low and alleviate the severe overbought condition left on many intraday indicators.

The wild swings today may be chalked up to light summer volumes, several economic indicators that came out this morning, earnings reports hitting the wires, BP capping their oil leak, Goldman Sachs getting their SEC decision announced, and options expiration tomorrow. But the damage to the likelihood of the top bearish count continues to be done. The rally from the July 1st low looks very impulsive, and is extremely deep for a 2nd wave that's supposed to be within a 3rd wave. I would expect to see more of a sharp quick less deep rally for a correction within such a large wave 3. It's not required to have those features, but it is often the case that it does have them. Although it doesn't violate any EWP rules, the likelihood of this count remaining on track has decreased in the last few days.

A big reversal signal tomorrow or early next week while staying below 1131.23 will re-ignite the probability of this count. A spike to the 1105 area and reversal would be a good start.


Since the top count's probability has been weakened this week I wanted to look at other possible counts. Above shows us in a large flat correction for wave 2. I never really liked this count because wave 1 is far from perfect and adding a far from perfect corrective count just makes it less likely overall, plus wave b of 2 should be a 3 wave move and it's more like an impulse move, and the whole correction would be very large and time consuming. With that said, it's still a possibility since it doesn't violate any EWP rules so I want to keep an eye on it. It would also explain the sharp impulsive nature of the rally since the July 1st lows since that rally would fit nicely into this count as a wave C of 2. If this count is correct, it means we'll most likely get a quick shot to just above 1131.23 before topping and rolling over in a big wave 3.

Remember, tomorrow is options expiration day and when combined with light summer volume it could get kind of wild.


PLEASE NOTE: THIS IS JUST AN ANALYSIS BLOG AND IN NO WAY GUARANTEES OR IMPLIES ANY PROFIT OR GAIN. THE DATA HERE IS MERELY AN EXPRESSED OPINION. TRADE AT YOUR OWN RISK.

Morning Update


The internals today are quite week, but not alarmingly so. On the NYSE, 73% of stocks are trading down and 81% of volume is to the downside. On the S&P, only 75 stocks are trading higher. So the internals are weak, but not so much to fully support wave 3 at various degrees.....YET. It's still early and there's plenty of time to get some momentum behind this decline and accelerate it lower.


The S&P had no problem taking out the 1090 area I cited yesterday so at least a short term correction of the July 1st rally is underway in my opinion. For the larger bearish count to be in play here (wave (iii) of 3 of [3] or C), I'd like to see this trend of lower highs continue until we can count a nice completed 5 wave impulsive decline. Right now, 1090 should act as resistance, but the 1095 area should hold, otherwise it would signal that this decline was just a correction and that eventually we'll see new highs in the coming days.

More later...


PLEASE NOTE: THIS IS JUST AN ANALYSIS BLOG AND IN NO WAY GUARANTEES OR IMPLIES ANY PROFIT OR GAIN. THE DATA HERE IS MERELY AN EXPRESSED OPINION. TRADE AT YOUR OWN RISK.

Wednesday, July 14, 2010

A Top and Reversal Coming Very Soon; Will it be Wave (iii) of 3 of [3] or C, or Just a Minor Correction?

INTERNALS


The market had trouble continuing its monster rally from the July 1st lows. The extreme overbought condition the market is in right now on the intraday charts has finally caught up with it. Although the market closed mixed across the board of various indices, the NYSE internals were slightly negative. So the amount of stocks pulling the market up is decreasing. Two days ago we had a similar scenario where at the end of a long push higher for days, the market closed very mixed with negative internals. The following day (Tuesday), the market surged higher with very strong internals. I don't feel this time we will see that again. For one, it's too obvious; and second, this time it is occurring after only one day of fierce rallying vs. several days of rallying for the last time. The current market rally is nearing its end, but that's not really what the big debate should be about. The market is overbought right now in the short term so a pullback is coming, that's a given. The real question is "at what degree of trend is this top going to be." Is this just a correction for a 5 wave impulsive rally from the July 1st lows as I proposed in this morning's post? Or is it the wave (ii) top we've been looking for?


S&P WAVE COUNT


Above shows my top S&P wave count. The wave (ii) rally is much too steep and impulsive-looking for my liking, but wave 2s do tend to be quite sharp and deep and with light summer volumes hitting the markets now, perhaps this rally is just exaggerated. We'll see soon enough. The late day surge today tells me the market might not be quite ready to give up on this rally quite yet, and that we might see a push to the 78% retracement level around 1105. That's awfully close to the 1131.23 critical level for the bears so I'd be aggressively shorting in this area since my risk (stop losses) would be fairly close by. I'm already 75% short of what I want to be for my short term positioning. A break above 1100 will get me thinking about adding more. A nice pop rally and reversal around the 1100-1105 level would be a good sign that the bears have come back in the market to take control.


MOMENTUM INDICATORS


The top chart shows how much the daily RSI had come out of oversold territory to where it is now at current levels. The RSI has made a new high above where it was at during the wave 2 high. Some may say that's because the RSI is showing that it's leading the market higher and will get price to above the wave 2 high as well. I disagree mainly because on the intraday timeframes momentum is severely waning with bearish divergences on numerous indicators. Plus, with a wave (iii) of 3 of [3] or C perhaps gearing up here, it would need to get as high as it could to shoot down as far and fast as it's going to in order to support a decline of that power and magnitude.

The bottom chart simply shows the stochastics, another momentum indicator. Although this is a much less reliable indicator than the RSI, I still wanted to show it because it's currently at the same level it was at the wave 2 top, and you can see that they are starting to "pinch" for a cross downward with plenty of room to run on the downside. I could go on and on with these momentum indicators showing topping behavior, but I think you get the point.


MINOR SUPPORT SHELF AT 1090


In the short term, I want to know what needs to occur for me to gain confidence that a top, whether short term or long term, has formed. Looking at the 3 day chart above, I see a minor support shelf at 1090 that seems to be important at the moment. If the market can break through this level convincingly and impulsively, then I think it can be safe to say that a top is in. Once the decline gets underway we should know fairly soon if we should favor the bullish or bearish count. Right now my money is still on the bearish count since 1131.23 has not been broken and the market is severely overbought intraday to where I'd still make money on even a short term pullback.


THE EURO


I mentioned the other day how I thought the euro had topped. I was wrong obviously as a new high was made. But there was little sustained follow through today, and the intraday RSI is showing a bearish divergence for quite some time as you can see above. The rally from wave 3 low is also a clear 3 wave move which is a correction. And when you take into account that the stock market appears to be topping at some degree, it would also make sense that the euro may be topping as well. The fact that there are about 800 pips to go to make a new low for wave 5 in the euro, it would be wise to look for shorting opportunities in the euro, or long opportunities in the US dollar, in my opinion.


PLEASE NOTE: THIS IS JUST AN ANALYSIS BLOG AND IN NO WAY GUARANTEES OR IMPLIES ANY PROFIT OR GAIN. THE DATA HERE IS MERELY AN EXPRESSED OPINION. TRADE AT YOUR OWN RISK.
Market Severely Overbought; Structure and Strength of Decline Important for Determining the Larger trend


Just a quick note. It appears the market's severe overbought condition has gotten the best of it, for now anyway. With 1131 still intact it leaves the larger term bearish case still very much possible. However a lot of damage has already been done, so the bears have a lot of work to do. The biggest piece of damage in my view is the impulsive-looking rally from the July 1st lows. This is quite a large, long, sharp and deep correction for what should be a wave 3 of [3] or C. Not really characteristic in my view. But the bears can still erase this bullish look with a strong and sharp impulsive decline of their own here. The structure, strength and volume on the decline will help us determine if this setback is wave (iii) of 3 of [3] or C, or if it's just correcting a 5 wave rally that started July 1st.

More later...

Tuesday, July 13, 2010

Rally is Strong


Well the fracturing of the various indices and low volume yesterday was just another pause and recharge before the next leg up in stocks. Today the market surged up with a gap at the open. I was hoping that it would soon reverse and mark a nice spike and reversal which may mark a top for wave (ii). But the market has held up nicely all day, is now pushing higher towards the close (for now), and the internals of the market are very strong although volume still remains a bit light. So the bears appear to be back in their caves sleeping for the summer with a few bulls running around doing what they please.

I'm not fighting the bulls in light summer trading, and if we're in large wave 3s at two degrees of trend, then the market needs to prove it. And it certainly isn't doing it SO FAR. If the market can reverse and decline heavy tomorrow, and preferably reverse with a gap down to create an island reversal pattern, then the bears may still have a chance. But the market needs to move lower quickly to support the proposed wave count. As it stands right now, the entire rally the past two weeks can count as a 5 wave move, suggesting that the larger trend has turned up. So the bulls have certainly gained the advantage here, and the new surge of strong internals gives them the momentum to keep pushing higher in the short/medium term.

The bears definitely have work to do. The close today, and the follow-up action tomorrow will tell us a lot.


UPDATED INTERNALS AFTER THE CLOSE


So the market closed very strong with volume that kissed the 13 day moving average on the NYSE. I see no bearish signs in the market right now, and the bulls definitely gained the upper hand today. That can easily completely reverse tomorrow, but it's gonna have to if the bears want a chance still. I'll discuss tomorrow or Thursday the impact and moves going forward if the rally continues higher and makes it evident that the big wave 3 again remains ellusive.


PLEASE NOTE: THIS IS JUST AN ANALYSIS BLOG AND IN NO WAY GUARANTEES OR IMPLIES ANY PROFIT OR GAIN. THE DATA HERE IS MERELY AN EXPRESSED OPINION. TRADE AT YOUR OWN RISK.

Monday, July 12, 2010

First Signs of Weakness Present; Now Need the Actual Rollover


The market is working hard to make any upward progress now, suggesting that the buying euphoria, or should I say the short covering euphoria, is almost over. The S&P has stalled hard right in the center of my reversal zone I mentioned early last week. The MACD has now crossed down on the hourly chart, and the daily RSI is in good territory to support another big down leg in the market. But we have no rollover or decline yet, so the market can easily shoot or grind higher from here. I can see a big shot higher tomorrow followed by a big reversal. That may be the shot the bears need to finally suck in the last of the bulls in the market before smacking them down with great bear force and numbers. We'll see. Any further rallying that gets into the 1185-1190 area would have me adding to my short positions with a stop just above 1131.23.


Although it appears we could easily get a sharp shot higher that will lead to a quick reversal, the divergence between the Dow and the other major indices left today is worth noting. Although it's by a very small margin, the Dow has made a new high today while the S&P and Nasdaq 100 has not. Now this divergence dwarfs in comparison to the big bullish divergence I pointed out July 2nd (click here) which led to the recent monster rally of wave '(ii)' we're currently in, but it's still a divergence and it's especially worth noting because Dow component Alcoa announced good earnings data tongiht which has the stock up over 3% after hours and might lead to the Dow rallying to new highs again tomorrow. This may further stretch the S&P and NDX's divergence from the Dow if they don't make new highs themselves. So I'll be watching that closely as a possible sign of an imminent top in the overall market.


So as I've said the past week, despite the market closing higher everyday, the internals continue to weaken every day as well. This is consistent with a correction. And although this can all be eliminated with a big up day tomorrow on strong internals, right now the data supports the recent move higher being a correction. Today the trend continued as the major indices squeaked out minor gains while internals actually turned negative as you can see above. Also, volume was well below the 13 day moving average at less than 1 billion shares on the NYSE. And the NYSE closed down today while the Dow closed up. This sometimes results in a sharp selloff the next day. So the market's rally has weakened severely, and the wave count, momentum and retracement indicators are ripe for a top and reversal at any moment. The market appears to be gearing up for a sharp move, and the current evidence suggests that move is to the downside. But just in case that move is to the upside, I hold that 1131.23 is the key level the bears need to hold.


Lastly I wanted to show the fractured nature of the market at what might be near topping levels. I interpret this sign after a sharp move in the preceding days as an exhaustion of that move. But last time all these indices were this mixed on light volume we had a monster rally the following day. Nothing is perfect, but I did want to point out the mixed nature of the overall market at this point in the rally. A big move appears imminent in the near future.


PLEASE NOTE: THIS IS JUST AN ANALYSIS BLOG AND IN NO WAY GUARANTEES OR IMPLIES ANY PROFIT OR GAIN. THE DATA HERE IS MERELY AN EXPRESSED OPINION. TRADE AT YOUR OWN RISK.

Sunday, July 11, 2010

Market Getting Ready to Fall, but May Work a Bit Higher First


The market appears to be undergoing a series of small 4th and 5th waves since the last few trading days have been composed of flat traded, followed by sharp rally thrusts at the end of the day. The trajectory of the rallies are flattening as well, suggesting a mild tiring of the uptrend. I see no signs of a top though so I have to assume higher levels in the short term. The market is well into my "reversal zone" and has filled the chart gap I've been pointing out. So the market is certainly free to fall hard at any moment, but I don't see that happening quite yet. I expect a push toward the upper end of the reversal zone around 1084 at the least. From there I'd expect to see even more weakening of the uptrend and possibly the finishing touches on wave (ii). The internals gradually decreased all week during this big rally but they still were quite strong overall regardless. But more importantly, NYSE volume fell off substantially as the week wore on and the market surged. So even though the internals were strong, they were still weakening mildly as the rally worked higher and overall volume continued to shrink. So this rally certainly looks corrective so far.


Over a week ago when I was warning of a bottom and reversal I pointed out that the daily RSI was in the same area that has marked bottoms in the market the past few times. The market was oversold in many indicators, but the daily RSI is the most reliable one to follow in my opinion. Notice now that last week's rally has significantly alleviated the RSI's oversold condition as it is nearing the same place that marked the top of wave '2'. But since wave '(ii)' is of a smaller degree than wave '2', it's possible that the RSI won't work much higher at all and just fall from near current levels.

So although there is little evidence that a top is in right now, nor is there evidence of any significant overbought or very tired uptrend, many indicators are well off their oversold levels and are now able to support a solid decline at any moment.


CURRENCIES


I mentioned last week that the euro was in what looked like an ending diagonal pattern which represents a severe weakening of trend. Ending diagonals are usually reversed sharply. Since the euro has a nice 3 wave corrective-looking pattern right now, and the fact that it declined in 5 waves late last week, it's possible a major top in the euro has formed. If so, I expect at least a 700+ pip fall to new lows on the year. This should put pressure on the stock market, especially if earnings outlooks aren't that great. Folks will know that a weaker euro, which means a stronger dollar, will only exacerbate the earnings problems going forward.


Also it's important to note the weakening momentum in the Japenese yen pairs as seen through the USD/JPY. These pairs tend to be tied to risk, and therefore they track equity markets quite well with a solid positive correlation. The USD/JPY has a bearish divergence on the RSI and may also be forming a head and shoulders top. Now there's no 5 wave decline yet, so a top is definitely not being called here. But if both the EUR/USD and the USD/JPY are topping and about to undergo large reversals, it should no doubt translate into a weaker stock market.

So I remain firmly bearish the S&P as long as it stays below 1131.23.


PLEASE NOTE: THIS IS JUST AN ANALYSIS BLOG AND IN NO WAY GUARANTEES OR IMPLIES ANY PROFIT OR GAIN. THE DATA HERE IS MERELY AN EXPRESSED OPINION. TRADE AT YOUR OWN RISK.

StatCounter