Saturday, March 13, 2010

Still Waiting for Signs of a Top

The market remains quite buoyant despite the internals, momentum and oversold condition that have accompanied it the past few days. The market can certainly work its way higher, but I would say that the probabilities are not in line with that outlook. An ideal situation at this point would be for a vacuum to be created, sucking in the rest of the sidelined bulls into this rally with a surge of optimism that gets so extreme that even the most prudent ones that have missed the meat of this recent rally will throw "all in" and surge this market in a sharp spike higher. That will get my attention because it will most likely be a capitulation to the upside that will be followed by a sharp reversal. This should mark the top for the short term at least and will be the first signal that a top is in and that I should be getting short this market. But until we get signs of a top and reversal, I have to remain patient and neutral.


RSI Study


The RSI is a very basic and simple momentum indicator. But I've found that of all the momentum indicators I use, the RSI is the most reliable, especially on the 1hr and above timeframes. Above is a chart of the S&P cash index hourly chart showing two instances in the past where price continued with a new high(s) and yet the RSI did not confirm those new highs. This divergence resulted in modest declines in both cases. You can see that this scenario is now occurring on a much more elongated scale where price has worked higher while the RSI has lagged drastically. My experience with this type of action suggests that when the market does top and reverse, it will be very very sharp. But this is not a timing indicator. If I get short too early, the market can continue higher and snap back down hard, but only get me back to my entry point. I don't take trades to try and break even, so I think the best strategy is to wait for signs of a top and reversal to then get on board and enjoy the ride lower.


MACD Histogram Study
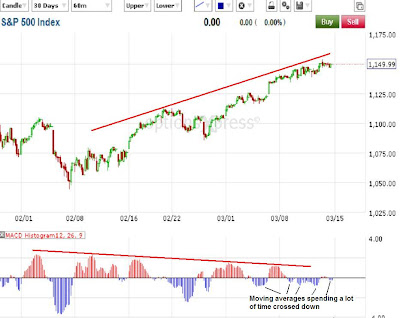


Above is another common and simple momentum indicator, the MACD histogram. Again I'm showing an hourly S&P chart which also shows a bearish divergence occurring as well. This chart supplements the RSI divergence above, because the MACD histogram at the bottom shows that the moving averages have steadily gotten tighter and tighter on this rally, and have recently spent a lot of time crossed down, despite the market's price grinding higher. Again, this extreme overbought exhausted rally condition usually will result in a sharp snap back decline. But when? This does not tell us anything about the timing, just that the rally has become quite extended and that the upcoming decline should be sharp.

So there it is, more evidence of an overbought extended rally. But without confirmation of a top and reversal, we have to allow the market more room to push higher.


PLEASE NOTE: THIS IS JUST AN ANALYSIS BLOG AND IN NO WAY GUARANTEES OR IMPLIES ANY PROFIT OR GAIN. THE DATA HERE IS MERELY AN EXPRESSED OPINION. TRADE AT YOUR OWN RISK.

Thursday, March 11, 2010

S&P Extends Higher, When Will it End?


Well the market has grinded higher, despite what I've seen as a weakening topping structure. This is a good exhibit about how difficult it can be to pick tops or bottoms without any confirmation. But, on the flip side of that, if you wait too long then you miss the big move. So it's a bit of a art to get that middle-ground. I've obviously been wrong the past few days in saying the market should fall soon as the S&P has rallied higher and higher during that time. But that doesn't change my stance. I have to take an objective approach and apply my methods to the market and call it as I see it. And I still see this market as extended to the upside and would rather wait to get positioned to the short side when I get confirmation, or a strong hint, that a top is in. Despite the rally looking impressive, and strong, I cannot justify getting long at this point with the analysis methods I use. So I'll wait to try and get short when I see a good opportunity.

Just to give you an idea of things I'm looking at and why I never bought into this rally is the SPY (S&P ETF) chart attached above. In looking at this market I think it's amazing that the big decline we saw into February was on increasing volume, while the rebound was done on decreasing volume. Yet the market continued to float higher and higher to test the prior highs. In the short term, the bulls can be happy and continue to play the market's short term movements, no matter what the logic is. But for the medium and long term bulls, this data here cannot be encouraging to them. The market has yet to show signs of an actual top, and may just continue to float higher for days. But the methods and analysis I use to not support getting long here, but instead wait for an opportunity to get short. So that's what I'll do. When I identify an opportunity, I'll share it here. But for now, I'll sit and wait.


PLEASE NOTE: THIS IS JUST AN ANALYSIS BLOG AND IN NO WAY GUARANTEES OR IMPLIES ANY PROFIT OR GAIN. THE DATA HERE IS MERELY AN EXPRESSED OPINION. TRADE AT YOUR OWN RISK.

Wednesday, March 10, 2010

Nothing's Changed

Well I've been dead wrong the past few days in projecting a top and reversal. But most people know calling an exact top or bottom is extremely difficult. There's no way I can get long this market right now, and there's no solid signs of a top yet to get short. So my stance remains the same, I see a top forming now, or very soon, and the structure and strength of the decline should tell me enough to become confident in establishing a position.

I was also quite wrong on the AUD/JPY position as I got blasted out of that position at a 268 pip loss. That was the first time, and maybe the last time, I've traded that pair. I'll be looking for other trades and post them here when they come up.


PLEASE NOTE: THIS IS JUST AN ANALYSIS BLOG AND IN NO WAY GUARANTEES OR IMPLIES ANY PROFIT OR GAIN. THE DATA HERE IS MERELY AN EXPRESSED OPINION. TRADE AT YOUR OWN RISK.

Tuesday, March 9, 2010

S&P Rally Still Looks Extended, Should Decline Soon

I know I sound like a broken record, but the S&P rally looks tired and should be reversing soon. The structure and strength of the decline will help me determine the larger trend. There's nothing really new to add to the short term picture; I'm still looking for a top in the S&P any time now, and a decline to the 1120 area at a minimum.

Looking at the bigger picture the higher risk indices have been on an impressive rally the past few weeks. Below are daily charts of the Russell 2000 small caps, Nasdaq Composite, Nasdaq 100, S&P and Dow. I'm showing you these charts because it can turn out to be a great scenario for the long term bears if this holds. At major turns in markets often the higher risk indices will lag, or well exceed, the rallies of the more stable blue chip S&P and Dow. You can see that this is now occuring with only the Dow and S&P failing to make new highs on the year. Of course though, this means nothing unless a top and reversal occurs before the blue chips make new highs. And I do want to note that oftentimes in big bull runs, the higher risk indices do lead the blue chips higher. So we just have to wait and see if this S&P and Dow divergence holds. If a short term top and reversal occurs without the Dow and S&P making new yearly highs, it will be reason for the bulls to sweat bullets big time as this is a major non-confirmation of the overall market's rally, and the longer it's held in place, the bigger the possible decline may be. So watch this.

There's nothing new to add to currencies. All is the same from the last post.


Russell 2000


Nasdaq Composite


Nasdaq 100


S&P Cash Index


Dow Industrials


PLEASE NOTE: THIS IS JUST AN ANALYSIS BLOG AND IN NO WAY GUARANTEES OR IMPLIES ANY PROFIT OR GAIN. THE DATA HERE IS MERELY AN EXPRESSED OPINION. TRADE AT YOUR OWN RISK.

Monday, March 8, 2010

S&P Poised to Decline; EUR/USD and AUD/JPY Looking Toppish

S&P 500 Cash Index 10min Chart and Count


The S&P did nothing today, perhaps it's exhausted as it should be if it's in a 5th wave at various degrees as projected above. Right now I'm counting the entire rally from 1044 as a 5 wave impulse rally. But my confidence in doing this is low since the initial move from 1044 to 1080 looks like a 3 wave affair. But the fact that the preceding decline barely looks like a 5 wave drop, but very easily looks like a 3 wave drop, makes me think it's possible that the current rally all the way from 1044is a 5 wave move. Plus a lot of the smaller indices have made new highs on the year, even though the S&P and Dow have not. So the bullish underpinnings are possibly there for the medium term, but in the very short term I think we're in for a pullback to 1120 at least.

If the structure of the upcoming decline looks like an impulsive 5 wave drop, and the internals and technicals supporting it, along with other various markets, look like they can support a big down move, then I'll consider changing my medium term stance to bearish again. But I'll wait for the market to prove to me it's bearish before I jump on board. Right now I only see a high probability for a short term decline that should take us to at least the 1120 level no matter what the larger wave count and trend are.


EUR/USD Bearish Setup


The bearish side of the EUR/USD is looking nice as it made a nice 5 wave decline and has rallied in 3 waves before finding resistance. This makes a nice setup to short this pair with a stop around 1.3710 or 1.3740 depending on risk tolerance. I just thought this was a nice setup and wanted to share it with you all. I don't plan on tracking this trade, but if anyone has any questions or comments on it please feel free to email me (toddsblog@comcast.net) or just post a comment. My main focus is on the AUD/JPY trade at the moment.


AUD/JPY


The AUD/JPY has hit resistance and is now showing signs of weakness. Oftentimes this pair mirrors the stock market and the fact that it couldn't stop out my current position to make a new high above the start of the preceding 5 wave drop, and that the S&P is setup to decline in the next day or so, makes this trade look a little better despite how deep the correction has gone. With that said, there's little wiggle room to allow much more upside on this pair. If the count is correct, it needs to get moving to the downside now. My stop remains at 82.90.


PLEASE NOTE: THIS IS JUST AN ANALYSIS BLOG AND IN NO WAY GUARANTEES OR IMPLIES ANY PROFIT OR GAIN. THE DATA HERE IS MERELY AN EXPRESSED OPINION. TRADE AT YOUR OWN RISK.

Sunday, March 7, 2010

S&P Finishing a Thrust from a Triangle


The S&P did nothing to make me think I should take a bearish stance. But the rally from the 1086 area us looking a bit exhausted technically, and the triangle in the 1120 area suggests the current rally at the end last week was a thrust which will be reversed shortly (click here see my chart projecting the triangle thrust last Thursday). The subdivisions of this proposed thrust appear complete, or very very close to being complete. A return to the apex of the triangle around 1120 is in order once the thrust upward is complete. If we get some follow through with an impulsive decline beneath that level, then I'll look at other technical indicators and internal data to see if it supports a resumption of the larger downtrend, or if it's just a correction before charging higher. So again, I'm left with waiting to see the next decline phase start so I can better orient myself to where we are in the larger trend. I'm neutral in the short term at this point as the rally seems a bit too tired to start to get long, and there is no signs of weakness yet to encourage me to get long. So I'm standing aside, waiting...


PLEASE NOTE: THIS IS JUST AN ANALYSIS BLOG AND IN NO WAY GUARANTEES OR IMPLIES ANY PROFIT OR GAIN. THE DATA HERE IS MERELY AN EXPRESSED OPINION. TRADE AT YOUR OWN RISK.

StatCounter