Saturday, February 14, 2009

S&P Needs to Selloff HARD Early Tuesday; Feb. 14, 2009


The wave structure is running out of waves 1 and 2 where it now needs to collapse in basically a straight line down in a wave (3) of 3 of (iii) immediately. The choppy decline seen yesterday and Thursday does not fit nicely into a wave count however we've seen this choppy widening downward movement in the past. Right before the October crash the market did the same thing for weeks before it finally made a straight line down that month. So we'll see if that happens again. 841 in the S&P futures needs to hold otherwise we could have a week or so of more rallying. I'm uncertain of the near term so I took half of my positions off and will re-establish them on a rally above 841 or a drop below 804. The fact that the Dow has traded and closed beneath the key 8000 level most of the week is very very encouraging to the bearish case.

Expect wave 3 of 3 of 3 to do a straight line down early Tuesday, if not, it's possible we'll have a sharp rally that lasts a week or two before that happens. But overall, I'm aggressively bearish and there's little doubt at all that the larger trend is down and the bears have control of this market.

Gold 5 Wave Decline; Feb. 14, 2009


Here is a 15 minute chart of gold futures which shows a 5 wave decline followed by a choppy corrective looking rally that has haulted fiercely at the 50% fibonacci level. Gold is bearish as long as it trades beneath $954.

Gold Looking Like it Will Fall off a Cliff Soon; Feb. 14, 2009


I have been wrong on gold for so long I haven't posted much on it. But I do see a severely weakening up trend here, and add that most of the TV and news I hear is bullish on gold and I can confidently say that this metal is in its last throws before a massive selloff. Look at the above daily chart of gold futures and you can see the RSI and MACD momentum indicators have failed to make new highs since December, even though price has continued to push higher. This doesn't tell us where or when the uptrend will end, but it does tell us that this rally won't last long and when it reverses it will be a fierce fierce selloff.

Thursday, February 12, 2009

5 Waves Down, Now a Correction; Feb. 12, 2009


The market dropped in a nice 5 waves from the highs but hit a wall late today with another garbage government plan. However the wave count shows that it's just a C wave in a "flat correction", which ended right at the previous 4th wave extreme. I don't expect this rally to continue much at all. Ultimately 873 in the S&P futures must not be exceeded, but a strong break of 840 would warrant caution. The market counts to be in a large 3rd wave right now, so if that's correct then this market should charge lower very very soon. Any further strength for a day or more might call that larger count into question. First significant resistance is the 840 area and ultimately, 873 is the ultimate breaking point. But I don't expect that level to be tested any time soon.

I expect a flat or down market tomorrow.

All Indices Confirmed 5 Waves Down; Feb. 12, 2009

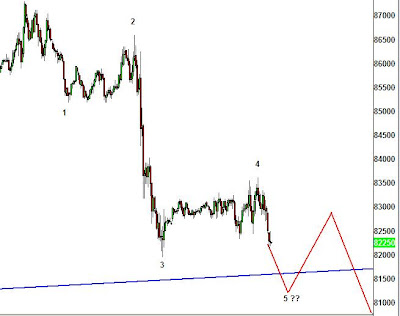
All the major indices' futures have now made new lows on the week which makes 5 waves down across the board. With the market opening in 10 minutes it's more than likely it will push the cash indices down to new lows as well. The S&P futures is bumping down on the that blue ascending trendline I drew in two posts prior so a solid break of that combined with 5 waves down from last week's high tells me this market should accelerate in downtrend over the coming weeks.

No time for a chart....

Wednesday, February 11, 2009

Only Nasdaq Futures Make 5 Down SO FAR; Feb. 11, 2009


The Nasdaq futures have made 5 waves down as seen from the above 30 min chart, however the Nasdaq 100 cash market has not, and only the S&P cash has also done soe. The S&P futures just touched the wave 3 low, but did not make a new low to consider it a 5th wave. This fracturing of wave structure in various markets is not good for the bearish case. We need all the indices to break through to a new low and follow the S&P cash and Nasdaq futures. Otherwise this is a non-confirmation which can lead to a sizeable rally.

Major Decline Phase Underway, 5 Waves Down Will Confirm It; Feb. 11, 2009


Can't talk long, but with the major selloff yesterday and most of the government nonsense out of the way, the market is now free to fall. Still waiting on a 5 wave decline which appears imminent, as well as a break of a trendline formed from the entire rally established at the 740 bottom (note blue ascending trendline in the 30min S&P futures chart above). 740 in the S&P cash is the first and minimum target.

StatCounter