Friday, October 22, 2010

Uptrend Still Intact

Complimentary Report: Revealing new perspective on China and Japan 


Did people know the market was open today?  Sure didn't feel like it.  Other than the Nasdaqs, it was a snoozefest today.  There was no real news out today, low volume on the uptrend has been the situation the past few months anyway, and the fact that it's a Friday may all lend itself today's lackluster day.  But in my opinion, having a light volume day like this after such a big uptrend is like a boxer putting his hands behind his back for a few seconds.  It was a good opportunity for the bears to strike since the bulls were light today. But the bears didn't strike, and the uptrend remains intact from a technical perspective, so I have to conclude that we're looking at higher levels ahead. 


Other than the Nasdaqs, the market didn't do anything to change my charts from yesterday so I'm just posting my primary long term count from yesterday again.  Just to reiterate, until the market proves to me the bears are in control, I'm looking for new highs on the year in at least some indices/sectors before Primary wave ((2)) tops.  If the bulls do not allow a meaningful decline beforehand, and alleviate the severe overbought condition the market's in right now, it means that new highs should be short lived and sharply reversed.  But that's later on and very speculative.  As for the short term, I'm looking for higher levels.

In the short term, the 3 wave drops and 5 wave rallies are still front page on my radar.  And the Nasdaq Composite would end up sporting a triple top if it were to fall from current levels.  Triple tops are extremely rare.  So it appears the Nasdaq will shoot higher from here.


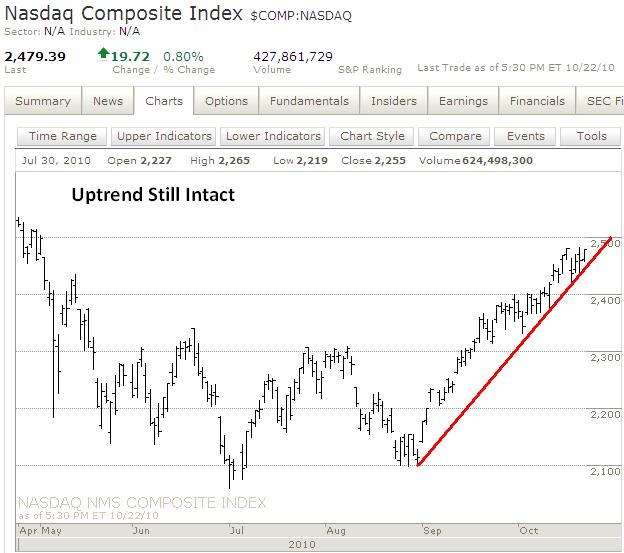
On the daily Nasdaq Composite chart you can see what I mean when I say the uptrend is still intact.  The series of higher lows and higher highs continues, and an uptrend line remains well intact.  Only a breakdown of that trendline, preferably impulsively, and lower lows will start the wheels in motion to move towards calling a top.  But right now, the evidence suggests higher levels ahead.

Free article: October Curse vs. Objective Analysis: The Choice Is Yours.


The VIX wave count still remains intact but is running out of room to fall.  I don't hold wave counts in the VIX very reliable as I've said before, but the 5 wave rally last week combined with other signs of a top in equities made it a compelling at the time.  But the slow choppy grind lower has been quite extended and I'd expect sharp rallies and declines if the VIX had formed a major bottom.  But without a new low, the count is still technically valid, and is one piece of evidence that might suggest the top in equities isn't as far away as I may think.

Nothing has changed in my analysis of the euro and it barely moved since last night.  The 3 wave drop and sharp rally this week make it appear we need another test of the highs before a top can called.  We should get some movement early next week after the G20 meeting, and as we get closer to the elections and the Fed meeting and more of the delicious QE2 everyone loves (input sarcasm here).

Speaking of the G20 meeting over the weekend, with the evidence appearing that we still need more new highs in at least some participants in the equity markets to even consider finding a top, I suspect Monday will be a strong up-day early as a result of that G20 meeting.  But the action following the big upward spike Monday will be even more telling.  So we watch.....and we wait....

Video: The Versatility of the Wave Principle
Timeless Trading Lesson
In the video below, EWI senior analyst and trading instructor Jeffrey Kennedy shows how the Wave Principle can help you identify a high-probability trade set up regardless of the direction of the larger trend.

This timeless educational video was taken from Jeffrey's renowned Trader's Classroom series and is being re-released because of its valuable lesson. If a few minutes isn't enough, get more FREE practical trading lessons from Jeffrey Kennedy in his latest eBook.

PLEASE NOTE: THIS IS JUST AN ANALYSIS BLOG AND IN NO WAY GUARANTEES OR IMPLIES ANY PROFIT OR GAIN. THE DATA HERE IS MERELY AN EXPRESSED OPINION. TRADE AT YOUR OWN RISK.

Thursday, October 21, 2010

There is Still no Evidence of a Top, All Short Term Signs Point Higher for Now


The action today was interesting since we made another slight new high with diverging momentum and then a sharp reversal in price and internals.  Early this morning on the rally I noticed that internals were strong with well over 400 S&P stocks trading higher and NYSE volume coming in solidly higher than declining volume.  But notice how the internals closed today.  Down volume ended up exceeding up volume and a big wave of S&P stocks ended up moving into the negative.  Also note that the Nasdaq Composite, XLF, small caps and NYSE were all significantly weaker than the Dow.  So again, although the bulls are still in full control, their climb higher continues to weaken.  And remember the strength and conviction the bears brought to the internals of the market on just one down day Tuesday.  When the bears finally gain control and take advantage of the opportunity to strike, they will be fresh and strong and going against an exhausted and stretched bull run.  The result should be a fast and ferocious decline.  The challenge is not “if?” it’s “when?”

If the wave count is correct in that Primary wave ((2)) topped in April, and Minor wave 1 completed in May and the action ever since then is Minor wave 2, then we’re not looking good as far as probabilities go.  The daily chart of the S&P illustrates what I’m saying.  The proposed Minor wave 2 rally is extremely stretched in both price and time.  And with it now trading well above the maximum comfortable retracement level of 78.6%, it’s time to start considering other counts to apply to our overall strategy in my view.


My current daily count is quite simple, which is how I always start my counts…..by keeping it simple and working it more complex only as required. The rally from August has been quite strong and somewhat impulsive looking, so it most likely is a 3rd or C wave.  I would think that a 3rd wave would be a little sharper and more impulsive looking, although it’s not required.  But it’s all about probabilities.  And I think it’s more probable that it’s a wave C.  Of course this would mean a Minor wave C of Intermediate wave (Z) of Primary wave ((2)).  It means that new highs in some, or all, of the major indices are coming in the near future, most likely for the rest of 2010.  If the bulls do not push the market down in a sustained correction to work off the severely overbought condition before it makes new highs on the year, then I think I can state with high certainty that those new highs would be short lived, and probably be accompanied by various intermarket and momentum divergences when it tops and reverses sharply.  So although we could certainly top and reverse at any time, the Nasdaq 100 has already made new highs on the year, and a few others appear to be on their way there as well.  But with that said, the risk is still to the downside and I personally would not be long equities unless I had 100% put protection.

Going back to the basics, I labeled the 15min chart to show what we’re dealing with at the current time.  You can see we’re still in an uptrend because declines are 3 wave moves and the recent rally is a 5 wave move.  Today’s reversal was nice, but there is still only a 3 wave move down in place.  It needs to continue downward and subdivide into a 5 wave move to even consider a top possibly being in.  And the bigger long term picture suggests higher levels to come.  So without any definitive evidence that a top is in, the proof lies with the bullish argument and higher levels until the bears can produce evidence that the uptrend is broken.

The 6 month daily chart of the S&P and XLF continue to paint a very bearish picture for overal equities.  The financials are not only sustaining their multi-month divergence from the S&P, but it seems to be accelerating it as it’s making more and more lower highs consistently while the S&P makes higher highs.  Eventually, one of these markets has to give way and join the other one.  The larger big picture evidence suggests that it will eventually be the S&P that drops and joins the XLF.  But again, the “when?” is the key question.  Right now, I see no signs of it happening.  So we have to continue to wait.


The break above 1.4005 last night in the euro busts the impulsive decline count I've been tracking and leaves a 3 wave move instead, suggesting new highs are on the way.  Although I can't be certain this will occur since this rally is stretched in sentiment, price, momentum and the wave count.  It's possible a truncated 5th wave will occur, or other currency majors will make new extremes and not the euro.  I just don't know for sure at this point.  But right now, the evidence suggests the euro uptrend is still intact.  Until I see something different, we have to assume the euro will move higher, for now.

Lastly, a look at the gold ETF (GLD) shows a nice clear 5 wave decline from the high, and there’s also one arguably in silver as well.  Of course this suggests that the trend in the metals has turned down.  It would be bearish for stocks as well as the euro, so we’ll have to watch these metals since they are the only short term bearish pieces of evidence I find compelling.


Video: The Versatility of the Wave Principle
Timeless Trading Lesson
In the video below, EWI senior analyst and trading instructor Jeffrey Kennedy shows how the Wave Principle can help you identify a high-probability trade set up regardless of the direction of the larger trend.

This timeless educational video was taken from Jeffrey's renowned Trader's Classroom series and is being re-released because of its valuable lesson. If a few minutes isn't enough, get more FREE practical trading lessons from Jeffrey Kennedy in his latest eBook.


PLEASE NOTE: THIS IS JUST AN ANALYSIS BLOG AND IN NO WAY GUARANTEES OR IMPLIES ANY PROFIT OR GAIN. THE DATA HERE IS MERELY AN EXPRESSED OPINION. TRADE AT YOUR OWN RISK.

Wednesday, October 20, 2010

The Market Give'th, and the Market Take'th Away;


Yesterday I mentioned that the action AFTER the selloff was probably more important than the selloff itself.  Well the fact that the bulls took back their losses from yesterday in just a couple hours speaks well for the bullish case.  But all is not bullish, far from it.  The bears have their troops lined up for a fight as well.  There is a lot of evidence right now that supports both the bullish and bearish cases.  I won't drone on about all of these things which will only lead to the conclusion that "the market may go up, but it may also go down."  So I'm going to discuss what I feel is important here at this juncture.

Internals today snapped back and tried to return fire from yesterday's big bearish decline.  But the bulls did not succeed in matching the bears' intensity.  Yesterday the bears moved the market down big with 1.27 billion shares and today the bulls could only muster up 1.1 billion shares; the bears had 89% of NYSE volume to the downside while the bulls only got 74% to the upside today; yesterday's NYSE decliners were at 2484 for the bears while today the bulls only had 2283 advancers; and the bears got 460 S&P stocks to close lower while the bulls had 429 close higher today.  So the intensity of the two moves belongs more to the bears than with the bulls.  I know this is only one day and it may not speak well to the bigger picture in and of itself.  But when you combine this evidence with the fact that over the past several months declines usually have big volume and the rallying has lighter volume, then it shows an internally weaker bullish underpinning to the rally.  And that often means the move is corrective in nature.

With that said, we've been talking about a weakening uptrend for months and the market has continued higher.  So we have to drill down the evidence deeper to get the specifics of where the market is moving in the short term.


The break above the key levels I cited yesterday (Dow 11,068 and S&P 1177) signal that the decline from Monday was just a 3 wave move, which is a correction.  Also note that the Dow is looking like it's heading to a resistance area at 11,150 that's been tested twice already (see a 10 day chart).  For it to stop again around that area would make it a triple top, and triple tops are extremely rare.  The evidence for the short term action suggests the bulls are still in control.  Even if the market doesn't make new highs and reverses from current levels, it could just mean that the above labeled ABC zig-zag correction is unfolding into a "combination correction" which would have it work its way lower in another ABC zig-zig correction to new lows in the coming days before surging higher to new highs.

Only an extremely sharp and deep impulsive move lower would put this current unfolding downward corrective count in jeopardy.  The bullish count above is my primary count right now.


This is the alternate count that is aggressively bearish.  For those who are Elliott Wave Principle "purists", you'll notice this leading diagonal does not have overlapping 4th and 1st waves so it's not possible to count it this way.  That's fine, it can simply be counted as a 5 wave decline without the diagonal labeling.  But it would be a real stretch if that were the case since it would not have EWP's guideline for the "right look", and the ensuring corrective rally is extremely sharp and deep. 

The reason I like this count being of at least a diagonal-like structure is because the waves lower get smaller and smaller and weaker and weaker as the market moved lower, then had a huge sharp straight up rally today.  All of which is typical behavior of the action during and following diagonals.  Also, the bearish 5 wave count lower remains valid since after the intitial surge this morning, the bulls hit a wall and could not accelerate it higher into the close.  Combining this with the weaker internals that accompanied yesterday's big bearish move helps support this above wave count as well. 

For this account to remain in contention, a sharp impulsive move lower must occur from near current levels very soon.

Free article: October Curse vs. Objective Analysis: The Choice Is Yours.


Although the divergence of financials from the rest of the market is front page news on the financial media and blogosphere, it's still a significant development and should be noted.  The financials continue to lag the blue chip indices drastically as the daily chart comparison with the Dow shows.  Eventually, one of these two will have to give way and move in line with the other's trend.  At this juncture, it seems that the blue chips will turn lower and follow financials eventually.  But when??? That has been the challenge for the bears.


The euro rallied with stocks today.  In fact, early in this morning's US session the euro was surging higher while stocks where just treading sideways-to-up slowly.  Stocks eventually followed the euro aggressively higher where both markets hit a brick wall and halted for the rest of the day.  Stocks broke their key levels today (1177 S&P and 11,068 Dow), but the euro did not exceed its key level at 1.4005.  At least not yet.  I don't have much confidence that this high will hold, but if it doesn't it probably means a test at the 1.4150 level in the near future.  I believe China is putting some data out at 10pm EST tonight, so perhaps this will move the euro, and the futures, strong enough in a direction that can give us some answers to help clear up the short term bull/bear arguement and hint what we can expect tomorrow.


Video: The Versatility of the Wave Principle
Timeless Trading Lesson

In the video below, EWI senior analyst and trading instructor Jeffrey Kennedy shows how the Wave Principle can help you identify a high-probability trade set up regardless of the direction of the larger trend.

This timeless educational video was taken from Jeffrey's renowned Trader's Classroom series and is being re-released because of its valuable lesson. If a few minutes isn't enough, get more FREE practical trading lessons from Jeffrey Kennedy in his latest eBook.

PLEASE NOTE: THIS IS JUST AN ANALYSIS BLOG AND IN NO WAY GUARANTEES OR IMPLIES ANY PROFIT OR GAIN. THE DATA HERE IS MERELY AN EXPRESSED OPINION. TRADE AT YOUR OWN RISK.

Bulls Quickly Regain Control


Well, once again the bulls wasted know time showing the market who's boss as they quickly came in and regained control of the market after a selloff.  This has been the trend the past several weeks, and it continues today.  The break above the key levels I cited yesterday make the drop from Monday's highs look like a 3 wave move, which is a correction. Now the market can fall from here to new lows, but it would probably just mean the correction downard is subdividing lower.  So that would have the markets pointed higher in the coming days/weeks, and probably a test and break above the highs on the year.  With new highs perhaps on the way, the market's failure to follow through with the April decline makes the entire move more like a correction and puts the bullish alternates I've been mentioning on the front page.  If there is not a sharp reversal downward sometime today, we need to consider the longer term bullish potential of the market while at the same time being aware and prepared for a top and collapse at any time.


All is not full blown bullish so I'm not getting long by any means.  The financials are again lagging this rally and the euro is still far off from its highs.  In addition, there is a slight chance that the decline in equities from Monday is a leading diagonal.  This would explain the sharp rise today, but obviously it must stay below Monday's highs to remain intact.  This is a much more unlikely scenario at this point though, that's why I didn't mention it before, and the key level of 1177 in the S&P marked the highest probability "kill point" for the bearish case.

So in summary, the market looks like it's probably resumed its uptrend since the wave structure suggests it.  Doing so means that the correction after the April top and reversal is extremely stretched in price and time and those highs will eventually be tested soon.  But I'm waiting for the close before I make any moves.  A sharp reversal downward would still keep the short term bearish case on track.  But holding these gains, or accelerating them, into the close will put me neutral for sure.


In addition, the currency majors I follow have not exceeded their key levels that would confirm a 3 wave drop from the highs.  The euro is awefully close, but if the aussie and the pound fail to do so, we can put them in the same column as the financials with their lagging behavior compared to the rest of the market.

PLEASE NOTE: THIS IS JUST AN ANALYSIS BLOG AND IN NO WAY GUARANTEES OR IMPLIES ANY PROFIT OR GAIN. THE DATA HERE IS MERELY AN EXPRESSED OPINION. TRADE AT YOUR OWN RISK.

Tuesday, October 19, 2010

Market Setup for Massive Decline in Place; We Now Have Clear Risk Levels Where we Know We're Wrong


Complimentary Report: Revealing new perspective on China and Japan


Don't forget to check out my post over the weekend for overall longer term perspective.  All is still relavent except for the short term wave count.  Click here for the post.

The internals today were quite a bloodbath.  Volume was quite high at 1.27 billion shares traded; much higher than what accompanied the final stages of the recent rally.  Also down volume represented 89% of total volume on the NYSE.  In the S&P, 460 stocks closed lower on the day.  So the bears stepped in today and let the markets know they're not dead yet. 

Today's action was just what the bears needed to do.  In yesterday's post I basically stated that the bears needed to step up today because the market is at the very tail end of the comfort zone allowed for a correction at this point.  If Primary wave 2 topped in April, then the bears needed to prove it today.  Well, today's action was a good start.  But it's far from confirmed that a top is in. The action tomorrow and the rest of the week will be more important and telling than what happened today.

The good news is that we now have solid resistance areas where we know we'd be wrong if the market broke above them.  So now we can establish short trades with clearly defined risk levels.  I discuss them below.


Let's keep it simple.  From an Elliott Wave Principle perspective, the Dow needs to stay below 11,068 and the S&P below 1177 to keep the impulsive count intact.  Once a large 5 wave impulse can be counted, we will then have to move those key levels up to yesterday's highs.  But right now, the 11,068 Dow and 1177 S&P, are key levels going forward from here because at this point, a break above those levels would make the decline look like a 3 wave drop, which is just a correction.  So those are key stopping levels for the short term action in my view, but ultimately only a break above yesterday's highs will completely eliminate the short term bearish view. 


I usually don't put much weight in VIX wave counts since I'm not sure how well the VIX can be tied to mass psychology, but I'll keep tracking this count as long as it stays valid.  Under this count, the VIX should continue aggressively higher in Submicro wave (3).  This would of course lead to more selling in equities.  A break above the Submicro wave (1) at 21.59 would signal that Submicro wave (3) is underway and moving aggressively higher.

Free article: October Curse vs. Objective Analysis: The Choice Is Yours.


The daily candles in the S&P show a change in crowd psychology to me.  The fact that we completely reversed all of yesterday's gains, closed well beneath yesterday's intraday low, and did it all on big NYSE volume, tells me that the previous trend is over.  The previous trend that was filled with excessive optimism and the lack of fear since the Fed will act as everyone's stop loss, and that massive asset inflation is on the way, has perhaps reversed here.  Today's selling of almost everything, accept the dollar, tells us that deflation got a grasp of the markets today.  The Fed can pump their billions of dollars into the market all they want, but if people hoard dollars instead of spending them, then prices will go down anyway.  Tomorrow is another "POMO day" as many people follow.  So we'll see what impact they will have on this market then.


The euro has been declining nicely, right according to forecasts.  If correct, the wave count suggests a major top is in and that the euro is working its way down to parity with the dollar, and probably much further.  At this point, as long as 1.4005 remains intact, I am comfortably short here.  Once a clear 5 waves down from the high is complete, we'll have to move that risk level up a bit, but for now staying below 1.4005 will keep the count looking impulsive.  A break above 1.4005 will make the drop a 3 wave move and therefore signal that most likely the pair will be moving to new highs in the near future.


Video: The Versatility of the Wave Principle
Timeless Trading Lesson

In the video below, EWI senior analyst and trading instructor Jeffrey Kennedy shows how the Wave Principle can help you identify a high-probability trade set up regardless of the direction of the larger trend.

This timeless educational video was taken from Jeffrey's renowned Trader's Classroom series and is being re-released because of its valuable lesson. If a few minutes isn't enough, get more FREE practical trading lessons from Jeffrey Kennedy in his latest eBook.


PLEASE NOTE: THIS IS JUST AN ANALYSIS BLOG AND IN NO WAY GUARANTEES OR IMPLIES ANY PROFIT OR GAIN. THE DATA HERE IS MERELY AN EXPRESSED OPINION. TRADE AT YOUR OWN RISK.

The Bears' Time is Now


For those of you who read my post yesterday afternoon you should have picked up that I felt the market was at the "make or break" stage in regards to the longer term bearish count, and whether Primary wave 2 already topped.  With the S&P trading well into the 1180s it really is the last area of resistance and the Nasdaq 100 already making a new high on the year, the bears needed to come in today and smack this market down to keep the Primary wave 3 count alive, in my view.  Otherwisde we'd need to look at some more bullish alternates suggesting Primary wave 2 had a little further to go.

So far, the bears are acting like they know this is where they have to do their last stand for Primary wave 2 to have topped.  Today's decline in the Dow is a nice, clear and sharp 5 wave impulsive decline and there are breakaway gaps in some of the major indices as well.  This is the type of behavior I'd like to see at a Minor wave 2 top.  What's also signficant is that when I was watching CNBC last night regarding the response to Apple and IBM being so negative, ALL, and I mean ALL the analysts and traders I saw there were only discussing and arguing about where to buy those stocks.  None of them talked about being careful here with the big run up they've had recently nor did they exercise any caution as to why the response to good earnings was so bad.  I mentioned last week that we knew Apple would blow out earnings, and they did, but what was important was the reaction to the good earnings report.  Today's negative reactions speaks a lot, and it speaks to the bears favor.  And according to CNBC last night, people are falling over themselves to "buy the dip" right now.  This again is good topping behavior for market participants because the blind optimism that stocks are stop lossed by the Fed and we should only be discussing buy points is what happens at major tops.

The key for the bears here is to hold onto these losses today, or even better - accelerate the losses into the close.  Now is as good a time as any to get aggressively short with a tolerable stop loss above yesterday's highs.

Featured Article, October Curse vs. Objective Analysis: The Choice Is Yours.


Another piece of good news for the bears is the action in the euro.  After completing five waves down it rallied about halfway back and had a sharp reversal into the last night's Asian session.  Again this is exactly the behavior I'd like to see in a wave 2 top.  Then, the sharp selloff into this morning's US session is also what we'd like to see if a wave 3 is underway.  The pair looks like it has further to fall so we should get more downside in the short term.  Only a break above the Submicro wave (2) high at 1.4005 would negate this short term bearish call.

PLEASE NOTE: THIS IS JUST AN ANALYSIS BLOG AND IN NO WAY GUARANTEES OR IMPLIES ANY PROFIT OR GAIN. THE DATA HERE IS MERELY AN EXPRESSED OPINION. TRADE AT YOUR OWN RISK.

Monday, October 18, 2010

Stocks Make New Highs, Euro and XLF do not, VIX 5 Wave Rally Still Viable

I wrote long post over the weekend of my overall view of the market at this juncture and other than the short term wave counts, it still holds relevance after today's action.  Please check it out if you haven't already because it will provide context to what I talk about in the coming days.  Click here for the post.


Volume today was fairly strong although definitely not jaw-droppingly strong.  The ups and downs and decliners vs. advancers were solidly bullish.  Nothing here to really note other than today the main indices made new highs on the internals shown here are far from stellar for the bulls.  It seems that the new highs of the past few weeks have been done with moderate enthusiasm.  This is usually the sign of a weakening rally.  But the market just continues higher with no end in sight, so perhaps weakening look will continue for several more weeks.  Until we get signs of a reversal, the market's trend remains up.


This chart was printed right at the close so the volume bar is not fully developed for today so it appears like a very low volume day.  But it should come close to kissing that 13 day moving average.  Notice that we get these little volume spikes, albeit today's was not impressive, on these big up days that are acting like launching pads and floors for the market.  Once we get closes below these "floors" on solid volume, we can begin to start compiling the evidence for a top.  But right now, I see these as building blocks for a sustained rally.  Looking at stocks alone, I see nothing that suggests a top or that I should be bearish at this point.  But the evidence surrounding stocks, like that in the euro, VIX and financials, suggests otherwise though.  So we'll see who wins here.


The financials made up for their major selloff Friday by taking those losses back today.  Much like I said in this weekend's post, although everything surround stocks appears to be bearish, in the past stocks have held up and the surrounding evidence turns up with stocks.  Today financials did just that.  But one day does not make up for several months of lagging as you can see from the comparison chart above of the S&P and XLF. 

But it does concern me that a lot of this selling is occuring into earnings and Citigroup surged higher today on their earnings and may signal a trend of sell the rumor buy the news type of thing where these financials will squeeze the shorts at earnings report time.  Also, and more importantly in my view, is that EVERYONE, and I mean EVERYONE, is talking about how the financials are lagging the overall stock market and that's a bad sign for stocks.  It's mentioned on CNBC TV at least twice a day, on their webpage, and check out the blogosphere; almost every blog out there is mentioning the "lagging financials".  The contrarian perspective is that if everyone knows about it, then it's probably meaningless and worth taking the opposite side of the trade. 

With that being said, the lag in the financials is still too big and great to completely ignore, and the historical significance as it relates to the 2007 early exit of the rally by financials does flash warning signs for the stock market here.  So we still need to watch it. 


Most major indices made new highs today, and the Nasdaq 100 has already made a new high on the year so right now I'm not sure on the wave count at the moment.  I need the market to play out a little more before I get a better degree of confidence in a count.  However, if the market doesn't fall hard soon, like tomorrow, the fact that it's in the very upper end of a comfortable retracement level if April 2010 marked a Primary wave 2 top, then I think that we can assume that those highs will be taken out soon.  The Nasdaq 100 has already done so, and although it often divergese from the rest of the indices at major turning points, it's also viewed as a market leader.  And I think it would be safe to look for new highs on the year if we get further steady buying like we had today.  If the market has been in a Primary wave 3 since April of 2010, then this would be the worst and most pathetic wave 3 I've ever seen since studying EWP.  It's still possible, don't get me wrong, but ask yourself..........does the action since April feel or appear like what you'd expect for a wave 3 to be?  In my view, the market needs to top now or those April highs are good as gone and we continue our hunt for the elusive Primary wave 2 top.

And if the market keeps chugging higher, keep in mind my counts for bullish alternatives.

The euro is still lagging the stock market in that it did not make a new high today.  But if stocks are the leader here, then expect the euro to do so soon as well.  But right now we have to count it as we see it at face value.  And right now the evidence is strong for the euro to have made a major top.  We can count 5 waves down from the highs, and although the current rally looks impulsive, it is still well short of last week's high and is having trouble rising through some fibonacci retracement ceilings in place.  Wave (2) may continue higher in the Asian and European sessions where 1.4030 and 1.4090 should offer solid resistance.

Video: The Versatility of the Wave Principle
Timeless Trading Lesson

In the video below, EWI senior analyst and trading instructor Jeffrey Kennedy shows how the Wave Principle can help you identify a high-probability trade set up regardless of the direction of the larger trend.

This timeless educational video was taken from Jeffrey's renowned Trader's Classroom series and is being re-released because of its valuable lesson. If a few minutes isn't enough, get more FREE practical trading lessons from Jeffrey Kennedy in his latest eBook.

PLEASE NOTE: THIS IS JUST AN ANALYSIS BLOG AND IN NO WAY GUARANTEES OR IMPLIES ANY PROFIT OR GAIN. THE DATA HERE IS MERELY AN EXPRESSED OPINION. TRADE AT YOUR OWN RISK.

StatCounter