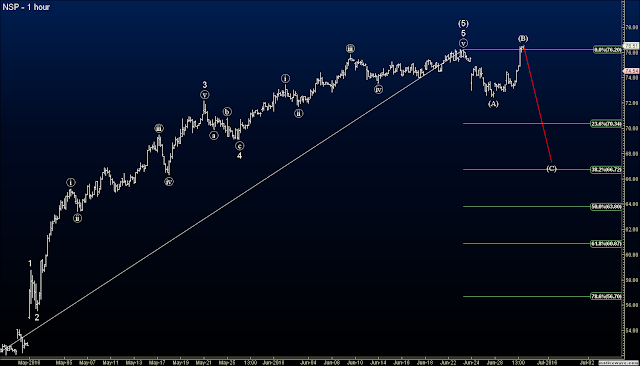
Although fundamentally and logically it does not seem accurate to think that the decline from last week is over, the wave count certainly suggests that it is. There are signs both ways that build a logical case, so I don't want to get too into the weeds on where the market is going long term. For the bullish case, the wave count, and current rally strength, support a long sustained bullish move. On the other hand, I think it's unlikely that the S&P drop over 100 points in just a couple days and then bottom and shoot higher. Usually tops and bottoms to big moves are a "process" that takes a while. They tend to not be a quick "event". Also, a "Flat Correction" is a sideways correction that is usually part of a 4th wave, not a wave 2. 2nd waves tend to be sharp and deep. So although the count looks good, it's not really what I'd expect to see for a second wave.
So the longer term may be a bit fuzzy, but what is clear though, is that for the short term, the market is still quite strong and bullish. There are not signs of the rally letting up. So I will remain a bull until I see some weakness and signs of a reversal.
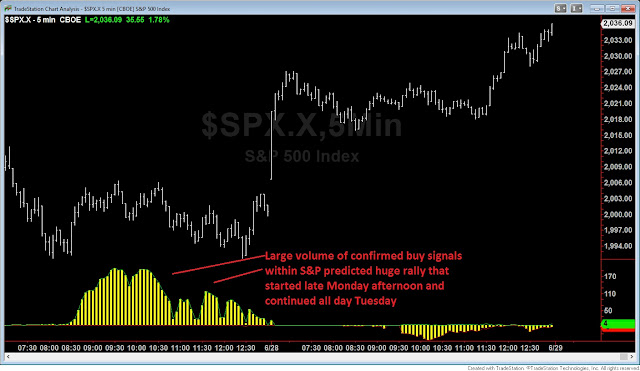
On a side note, I just wanted to point out how forward-looking my custom indicators really are. Yesterday, you can see that my indicator registered over 170 stocks in the S&P with confirmed buy signals. This was accompanied by choppy, and hard fought, price action sideways-to-down during that period. Then, as the signals declined, which usually means the stocks have since bottomed, reversed, and have shot higher therefore alleviating the overbought condition and no more registering a signal, the stock market as a whole shot higher about 40 points. I use this indicator, which is comprised of several custom indicators, to help make my stock selections as well.
Please support the blog and like this post :-)
PLEASE NOTE: THIS IS AN ELLIOTT WAVE BLOG EXPRESSING AN OPINION AND IN NO WAY GUARANTEES OR IMPLIES ANY PROFIT OR GAIN. TRADE AT YOUR OWN RISK.


