Thursday, June 10, 2010

What Does Today's Monster Rally Mean?


Yesterday's post called for a large downside drop today in a wave 3 at multiple degrees. Well a big move DID occur, but to the upside unfortunately. This was a complete surprise to me. The internals of the move were very very strong making me believe this is not going to be just a one day event. Unfortunately there is not that much room to the upside left for the S&P before it breaks above 1105.67, the start of its 5 wave decline. So I'm not confident that level will hold. If it doesn't hold, then it's still possible that wave (ii) is still unfolding and that the current push higher is a wave "c" of a "flat" correction. This would mean a slight push above 1105.67 before topping and reversing. But I don't like this count much at all since the current rally of the past few days does not look like a "C" wave at all since they are usually composed of sharp impulsive 5 wave moves. Not always, but usually. Also, this would have wave (ii) become quite long and wide, especially in time, compared to wave (i) that it would start to lose EWP's guideline for the "right look". Although it's not likely, it's still possible, so a break above 1105.67 would still put this alternate count on the forefront. But for now, I'm expecting 1105.67 to hold, and perhaps some more rallying or flat action tomorrow and maybe Monday before the next leg down. Notice the MACD is already diverging bearishly on the rally. So perhaps the rally won't last as long as I think.

Side note: I posted the 3rd video of Prechter on the top right of this blog if anyone's interested.


PLEASE NOTE: THIS IS JUST AN ANALYSIS BLOG AND IN NO WAY GUARANTEES OR IMPLIES ANY PROFIT OR GAIN. THE DATA HERE IS MERELY AN EXPRESSED OPINION. TRADE AT YOUR OWN RISK.

Wednesday, June 9, 2010

Wave ii May be Over.....if so, then the Stock Market is on the Verge of a Ferocious Selloff

Yesterday's Chart


Yesterday's Chart Updated with Today's Action


The top chart shows my primary count from yesterday which called for a sharp pop to complete wave ii and then a reversal. Today we got just that. Today's action is very bearish. Internals were strong most of the day but ended the day flat with the big reversal bringing the bears back into the market. The VIX also went from negative to positive territory as well. So the "all clear" signal for the bulls is definitely not in play yet. The sharp decline with the impulsive-looking structure at the end of trading today suggests that wave ii may be over and that wave iii of (iii) of 3 of [3] or C is underway. The market has been unfolding in beautiful impulsive declines and rallying in somewhat predictable 3 wave, or 3 wave combination, moves. Plus the internals of the market, along with other methods of technical analysis, are also falling into place to support the wave count. So all-in-all, things continue to look good for the bears. In order for this to continue, we need to see the market selloff sharply from here, If for some reason wave ii wants to chug a bit higher first, it needs to stay below 1105.67 for this count to remain on track.


1hr Nasdaq 100 and Fibonacci Chart


Above is an hourly chart of the Nasdaq 100 showing that the index's rally that started May 25th had halted and reversed at the 61% fibonacci retracement level of the previous 5 wave decline (count not charted).


10min Nasdaq 100 Chart and Fibonacci


Above is a 10min chart of the Nasdaq 100 showing that the rally that started June 8th also retraced a fibonacci level before reversing; only this time it was only 38%.

The fact that the index is respecting fibonacci retracement levels also suggests that the larger trend is still down. And the fact that the first retracement was 61%, and the second retracement was 38%, may tell us that the downtrend is building momentum and about ready to tumble lower in a big way. Solidly breaking through the S&P 1040 level will be a good sign that the downtrend has resumed, and the next wave of selling pressure should be extremely fierce and strong.


US Dollar vs. the Japanese Yen


One last thing, the currency pair that has been quite correlated to the stock market lately has been the USD/JPY. On the very small 10min timeframe we see a clear and clean 5 wave decline. This implies the trend has switched to down. So this too may be an indicator that the stock market's trend has also reversed to down as well. Tomorrow's action should give us more certainty of this. If the wave count I posted at the top of this blog is correct, there should be no mistake about it as the market should selloff VERY sharply very soon.


PLEASE NOTE: THIS IS JUST AN ANALYSIS BLOG AND IN NO WAY GUARANTEES OR IMPLIES ANY PROFIT OR GAIN. THE DATA HERE IS MERELY AN EXPRESSED OPINION. TRADE AT YOUR OWN RISK.

Tuesday, June 8, 2010

Two Wave Counts on the Table, Both Overall Bearish

KEY SUPPORT AT 1040


Above is a daily S&P cash chart showing the fierce support at the 1040 level of the S&P cash index. Once this level is taken out, there is little left but a few speed bumps to support the index until it reaches 900. So the bears taking out 1040 convincingly will be big. The more attempts at taking out this level, the weaker it gets. It's like eroding a castle wall with cannon blasts. One or two blasts from a cannon may not take the wall out, but each blast weakens it more and more until eventually it collapses and the army charges through with no resistance. In the markets, each attempt at taking out 1040 gobbles up stop losses and profit taking from the bears. But the more it's hit, the more of that support dissipates until it eventually gives way. So I'm watching 1040 closely.

Another thing to note today is that although the Dow and S&P's headline close was quite strong, the behavior of the overall market was quite weak. The high risk Nasdaqs and Russell 2000 indices all closed lower on the day despite the blue chip indices' sharp rally, which a lot which occurred in the last couple hours of trading. Today was a shift out of higher risk stocks, and into lower risk stocks. That is not the behavior of a new bull market. It's the behavior of an unhealthy and fearful market. So today's behavior was not bullish to me at all. The market may certainly grind a little bit higher in the short term, but the larger trend is still clearly down in my view.


PRIMARY WAVE COUNT


Above is my primary wave count of the short term picture. For the longer term count, check out last week's post (click here). This count is desirable because wave (ii) was composed of overlapping waves which is conducive of a correction, and it was also composed of sharp bursts higher which is conducive of a wave 2. It was followed by a sharp 5 wave decline into a low established yesterday, with very weak internals conducive of a wave 3 at some degree. So the rally and decline are unfolding perfectly for EWP standards, and the internals and structure support the wave count as well. So this count looks very good for me right now. Under this count, 1105.67 needs to hold, and the next wave will be a wave iii of (iii) of 3 of [3] or C. Which means it will be very fast and ferocious unrelenting selling for days. If correct, it's a wave the bears don't want to miss.
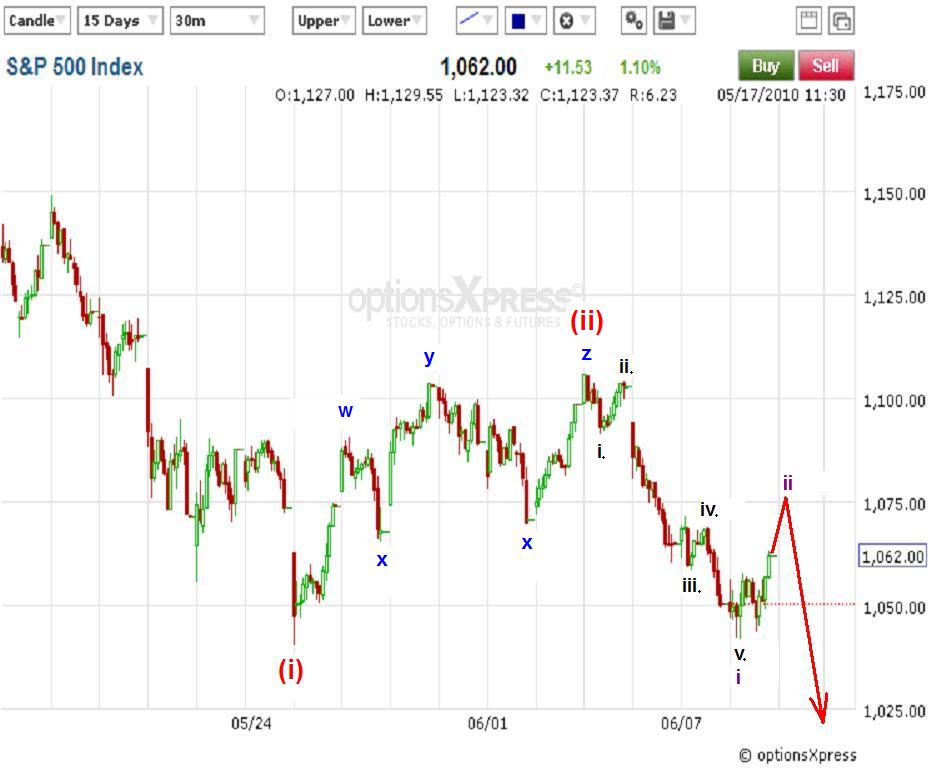

ALTERNATE COUNT


My alternate count suggests that wave (ii) is still unfolding in the form of a "flat correction". This means that wave "b" of the flat occurred yesterday, and todays is the start of a strong and sharp wave "c" that should just exceed wave "a" at 1105.67 to complete wave (ii) and then give way to very heavy selling pressure. This count is rated as less likely than the first one I mentioned because in order for this to be a flat correction it means that the proposed wave "b" would look a lot like a 5 wave move which a wave "b" cannot be. "B" waves can only be composed of 3 waves, or a combination of 3 waves. It cannot be a 5 wave impulse. Also, the decline from 1105.67 was very sharp and the internals were quite bearish, both of which are also not conducive of a wave "b". So although this count is still quite possible, it's just not as likely as the primary count above.

So right now my two top counts are overall bearish with one count leading to extreme selling any time now, and the other about to get hardcore selling pressure after it pops to just above 1105.67.


PLEASE NOTE: THIS IS JUST AN ANALYSIS BLOG AND IN NO WAY GUARANTEES OR IMPLIES ANY PROFIT OR GAIN. THE DATA HERE IS MERELY AN EXPRESSED OPINION. TRADE AT YOUR OWN RISK.
I'm unable to put up a thorough post tonight. Hopefully Elliott Wave International subscribers can get adequate information on the markets action today. The bottom line is that today's sideways action followed by a sharp selloff is conducive of a 4th an 5th wave. And this fits well with the wave structure that unfolded from last week's wave (ii) high since it's completed a five wave drop. So a short term rally might ensue to correct that five wave drop before more selling occurs. But last weeks wave (ii) high should hold and the trend is sharply lower as long as that high holds.

I should be up and running more normal for tomorrows post.

StatCounter