Thursday, April 14, 2016

Elliott Wave Forex - GBPAUD Trade Loses 236 pips (averaged) on 2/3 Position

This trade did not work out and I was stopped out at a loss of 236 pips (averaged entry) on 2/3 position.  This trade is not over and the hourly charts are showing some bullish life so if the 4hr or daily charts trigger another signal, I might try getting long again.  But I will be more patient the 2nd time and perhaps buy on strength since when this pair pops higher it will probably be ferocious

ORIGINAL TRADE SETUP:

Adding 1/3 to my current long position now that prices have dropped overnight:

Long now at 1.8747
Added to long position at 1.8646
Stop at 1.8460
Profit target at 1.9300  


Elliott Wave Forex Signals - Huge Bullish GBPAUD Trade

The daily charts fired off a buy signal on my proprietary indicators which is line with a Minor 4th wave rally in the GBPAUD.  There has also been long standing bullish divergence on momentum indicators since late February, like in the RSI as shown.  This is a large trade so I'm only taking a 1/3 position of my normal position size:

Long now at 1.8747
Stop at 1.8460
Profit target at 1.9300  

Please support the blog and like this post :-)


PLEASE NOTE: THIS IS AN ELLIOTT WAVE BLOG EXPRESSING AN OPINION AND IN NO WAY GUARANTEES OR IMPLIES ANY PROFIT OR GAIN. TRADE AT YOUR OWN RISK.

Elliott Wave Options Signals - Closed CPB at 19% Profit

Closed CPB at 19% Profit

Campbell Soup (CPD) took about two weeks but finally sold off and hit my target area so I closed the position today.  It was not a barn burner trade as it only yielded a 19%.  However, the risk/reward on this trade was quite favorable.  I take what the market will give me:

Entered put spread at $2.25 and sold it $2.67 for a $0.42 gain (19%), 


HERE IS THE ORIGINAL POST WITH TRADE SETUP:

Elliott Wave Options Signals - Campbell Soup (CPB)

Campbell Soup (CPB) is in a similar scenario as BKH in that it is about to undergo a C wave within a 2nd wave.  Here we have wave (c) within wave ((ii)).  I uses wave relationship Fibonacci analysis between wave (a) and (c) as well as Fibonacci retracement levels of wave ((i)) and we can see a confluence of support between $61 - $62, so my target will probably be in that area.  I placed a vertical put option spread for this trade:

Buy to open May 20  60/65 Put ($2.25)

Please support the blog and like this post :-)


PLEASE NOTE: THIS IS AN ELLIOTT WAVE BLOG EXPRESSING AN OPINION AND IN NO WAY GUARANTEES OR IMPLIES ANY PROFIT OR GAIN. TRADE AT YOUR OWN RISK.

Elliott Wave Options Signals - Shorting Sysco (SYY)

Shorting Sysco (SYY)

Sysco (SYY) has some weak price actions since launching on this wave 3 rally on big volume.  It has been chopping higher and rolling over for weeks and has now confirmed a sell signal on my proprietary indicators.  The wave count is also complete and we should see price decline to the lower channel and 38% Fibonacci retracement around $35.  Here is the trade:

Buy to open SYY May 20. 44/47 Put Vertical @ $0.90

Please support the blog and like this post :-)


PLEASE NOTE: THIS IS AN ELLIOTT WAVE BLOG EXPRESSING AN OPINION AND IN NO WAY GUARANTEES OR IMPLIES ANY PROFIT OR GAIN. TRADE AT YOUR OWN RISK.

Elliott Wave Option Signals - Closed TSN Short at 34% Profit

Elliott Wave Option Signals - Closed TSN Short at 34% Profit


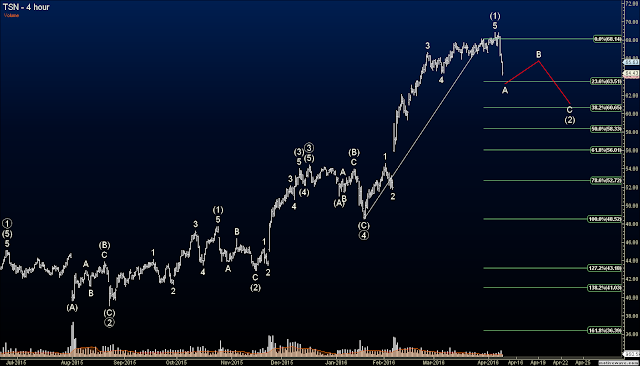
Tyson (TSN) dropped heavy yesterday and followed through with more this morning.  It has reached my initial target area so I closed the position at a 34% profit:

Bought at $3.75 and sold at $5.03 = +$1.28, or +34%

Here is the original post with the trade set up:

Elliott Wave Options Signals TSN

Tyson Foods (TSN) has a really nice setup here for a large gain.  You can see the labored action in wave 5, similar to an ending diagonal, which means a sharp shot downward could be coming soon.  This would also be a second wave in wave (2) which also lends itself to a sharp move lower.  I'm targeting the $62.50 area which would bring about a an 85% gain if I wait until expiration, which I probably won't.  Regardless, if price hits there sooner I wills till be looking at a 35%-60% profit sometime in April.  Here's the exact trade:

Buy to Open TSN May 20  60/70 Put

Please support the blog and like this post :-)


PLEASE NOTE: THIS IS AN ELLIOTT WAVE BLOG EXPRESSING AN OPINION AND IN NO WAY GUARANTEES OR IMPLIES ANY PROFIT OR GAIN. TRADE AT YOUR OWN RISK.
Wednesday, April 13, 2016

Elliott Wave Indexes

Indexes in RadarScreen
This is my stock RadarScreen in Tradestation.  Notice how the indexes are solidly in the green yet all my options position stocks are well in the red.  That's when you know you've picked the right stocks to short as they are extremely weak relative to the rest of the market.  In addition, I feel this is also an internal barometer of strength for the overall market as well.  In addition, today there are 144 bearish signals on my proprietary indicators and only 12 bullish signals.  We also have gap opens now in the market which, at this stage and with this price action, can easily be interpreted as exhaustion gaps.  I continue to feel this market's bull run is on borrowed time and I'm very happy holding my put spreads in place.

Please support the blog and like this post :-)


PLEASE NOTE: THIS IS AN ELLIOTT WAVE BLOG EXPRESSING AN OPINION AND IN NO WAY GUARANTEES OR IMPLIES ANY PROFIT OR GAIN. TRADE AT YOUR OWN RISK.

Tuesday, April 12, 2016

Elliott Wave Indexes - Bearish Divergence Intraday

Bearish Divergence

Today's rally does not deter my bearish call at all as it is internally weak.  I also just noted intraday bearish divergence in the Russell small caps from the S&P and it should result in at least a modest set back, but could possibly be the start of a major down push.

Please support the blog and like this post :-)


PLEASE NOTE: THIS IS AN ELLIOTT WAVE BLOG EXPRESSING AN OPINION AND IN NO WAY GUARANTEES OR IMPLIES ANY PROFIT OR GAIN. TRADE AT YOUR OWN RISK.

Elliott Wave Forex Signals - Adding to GBPAUD Long Trade

Adding 1/3 to my current long position now that prices have dropped overnight:


Long now at 1.8747
Added to long position at 1.8646
Stop at 1.8460
Profit target at 1.9300  


Elliott Wave Forex Signals - Huge Bullish GBPAUD Trade

The daily charts fired off a buy signal on my proprietary indicators which is line with a Minor 4th wave rally in the GBPAUD.  There has also been long standing bullish divergence on momentum indicators since late February, like in the RSI as shown.  This is a large trade so I'm only taking a 1/3 position of my normal position size:

Long now at 1.8747
Stop at 1.8460
Profit target at 1.9300  

Please support the blog and like this post :-)


PLEASE NOTE: THIS IS AN ELLIOTT WAVE BLOG EXPRESSING AN OPINION AND IN NO WAY GUARANTEES OR IMPLIES ANY PROFIT OR GAIN. TRADE AT YOUR OWN RISK.

Monday, April 11, 2016

Elliott Wave Options Signals - CTL CenturyLink

Elliott Wave Options Signals - CTL CenturyLink

CenturyLink (CTL) confirmed a bearish signal on my proprietary indicator with it's close today.  This fits well with a sharp move lower with the rest of the stock market.  With CTL, I am projecting a Minor wave C drop to at least the 23% Fibonacci retracement at $29.78 in what is an ABC Flat Correction since wave B exceeded the start of wave A.  Typically, in Flat Corrections, wave C will break just a little below wave A before completing.  This is why I don't think the correction will go much deeper than the 23% Fibo retracement.  Here is my trade:

Buy to opn CTL May 20  29/33 Put Vertical at $1.38.


Please support the blog and like this post :-)


PLEASE NOTE: THIS IS AN ELLIOTT WAVE BLOG EXPRESSING AN OPINION AND IN NO WAY GUARANTEES OR IMPLIES ANY PROFIT OR GAIN. TRADE AT YOUR OWN RISK.

Elliott Wave Forex Signals - Huge Bullish GBPAUD Trade

Elliott Wave Forex Signals - Huge Bullish GBPAUD Trade

The daily charts fired off a buy signal on my proprietary indicators which is line with a Minor 4th wave rally in the GBPAUD.  There has also been long standing bullish divergence on momentum indicators since late February, like in the RSI as shown.  This is a large trade so I'm only taking a 1/3 position of my normal position size:

Long now at 1.8747
Stop at 1.8460
Profit target at 1.9300  

Please support the blog and like this post :-)


PLEASE NOTE: THIS IS AN ELLIOTT WAVE BLOG EXPRESSING AN OPINION AND IN NO WAY GUARANTEES OR IMPLIES ANY PROFIT OR GAIN. TRADE AT YOUR OWN RISK.

Elliott Wave Futures Signals - ES Topping Formation

Elliott Wave Futures Signals - ES Topping Formation

The S&P is still topping and has a nice head and shoulders top formation in place and I expect the market to sell off any minute.  Not internal change to the bearish outlook as my proprietary indicators have 144 bearish signals triggered and only 6 bullish signals.

Elliott wave stock market breadth

In looking at market breadth and internal strength I get a bit of a mixed bag but a slightly bearish bias overall.  The $DWC.X, Russell, and especially the Nasdaq all have slight or significant bearish divergence between price and advance/decline issues.  The Nasdaq and Russell being the worst.  And seeing as that those two indexes tend to be good risk barometers, and therefore they tend to be the first to signal new moves, that's why I have a slightly bearish bias to market breadth overall.

But to be fair and objective, the NYSE and ARCA, which are two very strong overall market bellwethers, actually have their advance/decline data rising higher than price, which is often a bullish indication.

Please support the blog and like this post :-)


PLEASE NOTE: THIS IS AN ELLIOTT WAVE BLOG EXPRESSING AN OPINION AND IN NO WAY GUARANTEES OR IMPLIES ANY PROFIT OR GAIN. TRADE AT YOUR OWN RISK.

StatCounter