Saturday, January 7, 2017

Forex Analysis - USDJPY

Forex US Dollar vs Japanese Yen

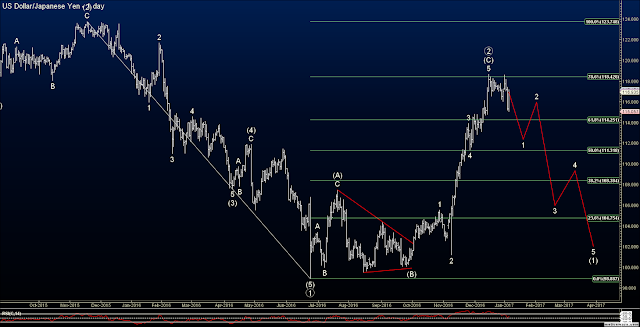
In looking at my forex workspace, I note a good longer term opportunity with shorting the USDJPY.  Notice that price has rallied sharply the last few months and has triggered my custom indicator to print some magenta bearish paint bars in the middle of the rally.  These paint bars usually indicate when a currency has moved too far too fast, and so at least a short term pause or pull back is in order.  However, you can see that the USDJPY ignored this several times and kept shooting higher.

After the magenta paint bars, you'll notice some red paint bars which is a combination of momentum and volatility indicators noting that price has gone way too far and to look for a confirmation signal with a price close below the key moving average (yellow line).  Then, two days ago, you'll notice that the signal was confirmed with a close below the yellow line, and the upper band of the volatility indicator.  This is accompanied by a modified RSI which has been severely overbought for several weeks and is starting to turn down, while at the same time there is a bearish squeeze in my histogram just below it.  So you have a bearish squeeze at the same time the RSI is overbought, which is a very bearish sign.  Lastly, you'll notice that my momentum indicator is also showing bearish divergence.

Now this is a large and long uptrend that I'm calling to be broken, and usually these types of trends don't give up easily.  You can see that the day after the USDJPY broke below the moving average (yellow line) that it immediately reversed higher and kissed the yellow line and practically close right on it on Friday.  Then, when you look at my momentum comparison of all major currencies in the bottom right of the work space, you'll see that the US Dollar is all by its lonesome trying to make a push higher, while everything else, including the Japanese yen, is trending down.  Directly above that, you'll see that the US and Canadian dollars are the strongest in the market right now as well.  So, I'm not entirely confident that the USDJPY will breakdown immediately, as there may be another push to a new high in the next few days.  If so, I'll be looking closely for reversal patterns at that new high to hit it short.  I am currently modestly short the USDJPY now, but am prepared for a new high to add to that short position.

Forex analysis


Let's look at the wave count and Fibonacci data. I can count a sharp wave ((2)) rally ending right at the 78% Fibonacci level of the decline that started from 123.75.  If this count is correct, the USDJPY should not make a new high and should almost immediately undergo a sharp decline lower in a large wave ((3)) down.  If so, this would be a great risk/reward trade as I can go short from current levels with a stop just above 118.50, risking a little over 150 pips with the potential to 2000+ pips.  Now I doubt I would hold it that long, but it gives you an idea of the limited upside from here, and the extraordinary potential to the downside.

Please support the blog and like this post :-)


PLEASE NOTE: THIS IS AN ELLIOTT WAVE BLOG EXPRESSING AN OPINION AND IN NO WAY GUARANTEES OR IMPLIES ANY PROFIT OR GAIN. TRADE AT YOUR OWN RISK.

S&P Futures and Financial Sector Analysis

@ES S&P Analysis

The market has more or less traced out as I have projected.  The key level for the long term bullish view is the US Election Day reversal and rally from 2023.25.  The market appears to be unfolding in a series of 1 and 2 waves which is very bullish.  Keeping the recent swing lows intact bolsters the bullish view as well.  In addition, the Donald Trump bullish US economic boost hope is still in place, and despite recent overbought indicators, the market has only paused and then resumed its rally.  Again, this fits well with the wave count above.

XLF Financials Analysis

In looking at the stock market sector breakdown, I see that sectors such as Biotech and Health Care are trending up quite sharply.  On the other hand, Financials and Gold Miners are losing some steam.  I want to focus on Financials primarily for now, and specifically the XLF.  There are several bearish signals in place that has resulted in me getting short numerous financial stocks such as Morgan Stanley, Bank of America and Capital One to name a few.

Notice in the chart above the magenta paint bar which marks when the stock has moved too far too fast, and it's confirmed by the green histogram below as it breached the upper moving average plotted with white dashes.  The stock was also well above its volatility band (magenta average below price).  The stock later stalled, and a bearish signal initiated with the red paint bars, which was later confirmed by a close below a key moving average.  In addition, you will notice at the bottom that the modified RSI has been running overbought for a long time and is now trending down with plenty of room to run, and there is a bearish squeeze on the histogram, accompanied by bearish divergence on my momentum indicator.  This sector is extremely bearish from a technical standpoint, so I am looking to continue getting short individual stocks, or even the sector ETF as a whole, over the upcoming weeks.

Please support the blog and like this post :-)


PLEASE NOTE: THIS IS AN ELLIOTT WAVE BLOG EXPRESSING AN OPINION AND IN NO WAY GUARANTEES OR IMPLIES ANY PROFIT OR GAIN. TRADE AT YOUR OWN RISK.
Monday, December 19, 2016

S&P Futures Analysis

S&P Futures Chart

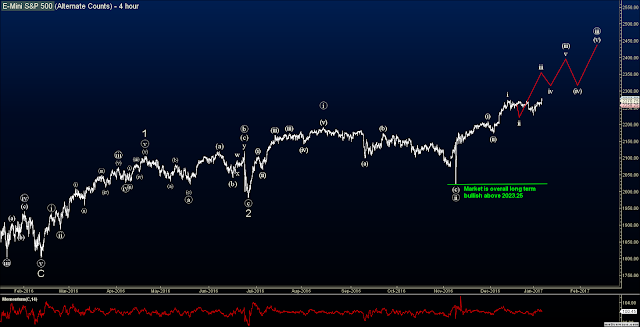
The market has held up well the past week or so and my wave count remains intact.  It looks like a fourth wave consolidation is occurring and a shot higher will ensue shortly.  I don't see any big action occurring until the New Year, but a steady float higher should occur up until then.

The US Dollar appears overbought, along with all the Japanese yen pairs, so short term selling of the USD and buying of JPY might be wise when a technical setup coincides with those directions.  I would remain nimble and flexible with the trades and view them as short term corrective opportunities as they are Fed related moves leading up to this point.  Long term, they should continue in their current directions, but short term they are due for a correction.

S&P Futures Intraday Chart

Here is a snapshot that drills down the wave count a little more from the daily chart.  This 4 hour chart shows a strong rally that should continue to the 2400-2450 area before any meaningful correction.  There are multiple alternate counts that also conclude at the 2400 level as well, so that level appears be a good place to look for a solid correction.

Please support the blog and like this post :-)


PLEASE NOTE: THIS IS AN ELLIOTT WAVE BLOG EXPRESSING AN OPINION AND IN NO WAY GUARANTEES OR IMPLIES ANY PROFIT OR GAIN. TRADE AT YOUR OWN RISK.

Sunday, December 11, 2016

S&P Analysis

S&P Futures

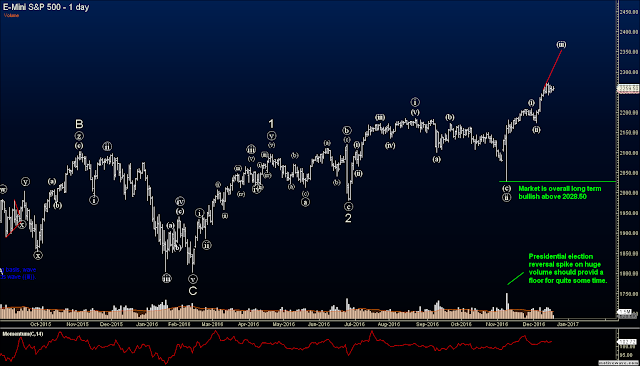
The S&P's are moving as projected a few weeks ago.  The presidential election launching pad has pushed this rally higher and higher and should continue to do so over the coming several weeks.  As you can see from the wave count, a breakout from a multi-month consolidation period has ended and the market is shooting higher, and has a ways to go.  Also, seasonal forces, and a pro-stock market Fed, should help the market float higher.

ES futures analysis

On the S&P futures daily chart of the day contract you'll note in the chart above that the market is well overbought.  This is determined by the huge separation of price relative to a key moving average in combination with the MIFT RSI being overbought.  In other words, price has moved way to fast than it historically has done so before.  This is a sign of a strong rally, but it also means that either some consolidation, or a modest decline is in order to allow the moving average to catch up to price.  Any meaningful pullback I would simply view as a buying opportunity at this juncture anyway.

In addition, most individual sectors are also significantly overbought, a few are flat, and only Gold Miners are oversold.  So the market is a bit stretched, but ultimately it will move higher in the longer term, so any pullbacks I would see as opportunities to buy.

Please support the blog and like this post :-)


PLEASE NOTE: THIS IS AN ELLIOTT WAVE BLOG EXPRESSING AN OPINION AND IN NO WAY GUARANTEES OR IMPLIES ANY PROFIT OR GAIN. TRADE AT YOUR OWN RISK.
Friday, November 25, 2016

Stock Market Analysis

Stock Market Analysis

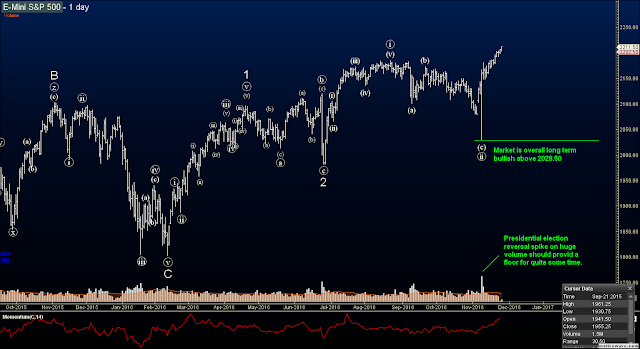
The stock market has been quite a mess the past year or so with with choppy sideways-to-up price action that it has had me on the sidelines for the most part.  I have been trying to trade individual stocks through options trades, and focusing on forex as a result.  The one thing notable that has occurred recently is the price action surrounding the US presidential election.  On election day, the overnight session so a huge drop in the markets when Donald Trump appeared to be the victor.  But when the US traders woke up the next day, they quickly bought up the oversold market and carried it to new highs from the previous trading day.  This was also done on huge volume of course.  So, market players are telling us that although there was initial fear of a Trump victory based on potential instability in the US, once the panic subsided market players saw the Trump win good for the economy and stock market.  Whether that is true and will play out, we don't know obviously.  But the market is pricing in positive economics and earnings for at least 6 months out.

So we have a huge reversal higher on a giant volume spike from back earlier this month.  The low is 2028.50 for that day.  To me, that is a key level for the bulls.  For the long term, as long as price remains above this level, the market is overall bullish 6 months out from the day you're in.  There will be pullbacks along the way, but long term investors would be wise to go long the markets long as that level remains intact.

There are several signs of a short term pullback in stocks across the board, as well in Japanese yen pairs in forex, so I think if buyers are patient they can wait for that pullback to get long some stocks that may be to pricey right now.  I am personally getting short the USDJPY and GBPJPY in forex.


Please support the blog and like this post :-)


PLEASE NOTE: THIS IS AN ELLIOTT WAVE BLOG EXPRESSING AN OPINION AND IN NO WAY GUARANTEES OR IMPLIES ANY PROFIT OR GAIN. TRADE AT YOUR OWN RISK.

Monday, October 3, 2016

Elliott Wave Option Signals - Short SYMC & Long SRCL

Short SYMC option spread

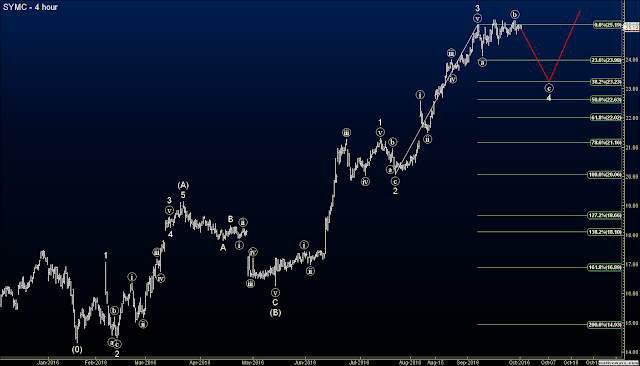
Symantec (SYMC) has been on a tear for a long time, but after Minor wave 3, we see some choppy and weak rising off the wave ((a)) low.  This is a topping structure and indicative of a ((b)) wave.  Once complete, a sharp wave ((c)) down should take place, pulling prices to the $22.60 - $24.00 range to complete Minor wave 4.  So I'm hitting it short with a put spread that will cover earnings postings early November:

Buy SYMC Nov 18  23/26 put spread at $1.19
__________________

Long SRCL

On flipside, Stericycle Inc (SRCL) appears to have completed an Intermediate A-B-C correction to the downside.  After a sharp gap lower, the stock has trickled down to new lows but not in a convincing fashion.  Downside momentum appears to have become exhausted and a possible inverse head and shoulders pattern may be forming.  A long signal triggered on my custom indicators so I'm hitting it long here with a call spread to target a confluence of Fibonacci retracement levels of wave (C) and the entire A-B-C move at the $95 area.  Here is the trade:

Buy SRCL Nov 18  75/90 call spread at $6.24

Please support the blog and like this post :-)


PLEASE NOTE: THIS IS AN ELLIOTT WAVE BLOG EXPRESSING AN OPINION AND IN NO WAY GUARANTEES OR IMPLIES ANY PROFIT OR GAIN. TRADE AT YOUR OWN RISK.

Tuesday, September 27, 2016

S&P Futures Wave Count

S&P Futures

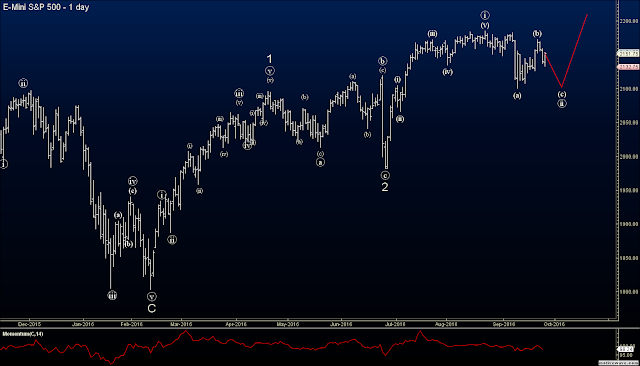
The stock market and forex spot have been quite signal free ans opporunity free for about a month.  But with the US presidential election heating hp, and traders back their desks after summer break, I'm expecting things to pickup.

The S&P appears to be in the early stages of a manor bull run, although only 3 waves up have printed so far, so the bull run is far from confirmed.  In the short term, look for (c) of ((2)) to pull price down to around the 2100 level. Price action around that level should give us a clue of what is next.

Please support the blog and like this post :-)


PLEASE NOTE: THIS IS AN ELLIOTT WAVE BLOG EXPRESSING AN OPINION AND IN NO WAY GUARANTEES OR IMPLIES ANY PROFIT OR GAIN. TRADE AT YOUR OWN RISK.

Friday, September 2, 2016

Elliott Wave Options Signals - Heavy Short on Small Caps

TZA Long Options Signal

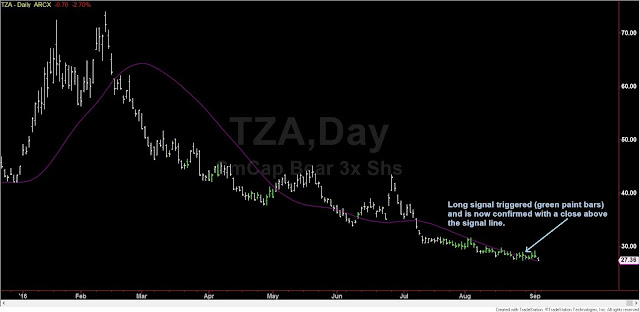
The TZA is an ETF that triple shorts small cap stocks.  So, needless to say, it's a wild security.  As a result, I'm playing this small, but can't resist the opportunity because if I'm right, it can easily result in a 100% - 300% profit on a call option spread.

The TZA has been oversold for a while and has spiked higher at the beginning of the year, only to fall back down fairly quickly as well.  However, the choppy and slow grind lower the past two months is indicative of a waning downtrend, and so a sharp reversal is on the horizon.  Waiting for a buy signal is still key, and I got one a few days ago with a close above the signal line.

TZA Wave Count

Due to what the TZA consists of, and it's lack of liquidity, it's not exactly the best medium to count waves.  It's probably better to analyze the Russell (@TF).  But looking at the TZA on the hourly time frame, you can see a decent wave count suggesting a long wave ((v)) in place.  Most likely there will be a shot lower to complete wave ((v)), but that should quickly be met by a reversal higher.  I am targeting the $32 area just above the previous 4th wave.  The setup and risk/reward ratio is well worth giving this wild security a shot on the long side (so short small caps):

Buy TZA Oct 14  27.5/32 Call Spread at $0.98


Please support the blog and like this post :-)


PLEASE NOTE: THIS IS AN ELLIOTT WAVE BLOG EXPRESSING AN OPINION AND IN NO WAY GUARANTEES OR IMPLIES ANY PROFIT OR GAIN. TRADE AT YOUR OWN RISK.
Thursday, September 1, 2016

Elliott Wave Forex Signals - Closed GBPJPY Long at 528 Pip Profit

The stock market is just a mess of low volatility and general apathy.  I do not want to read too much into the waves or price action with this kind of movement.  The summertime lull of trading officially ends after Labor Day so I expect some solid moves to reprice the market to appropriate levels in the days/weeks following Labor Day.  So some good moves should occur as September gets underway.  Until then, I am focusing on my options trades and the forex trades I detail below.


GBPJPY Long

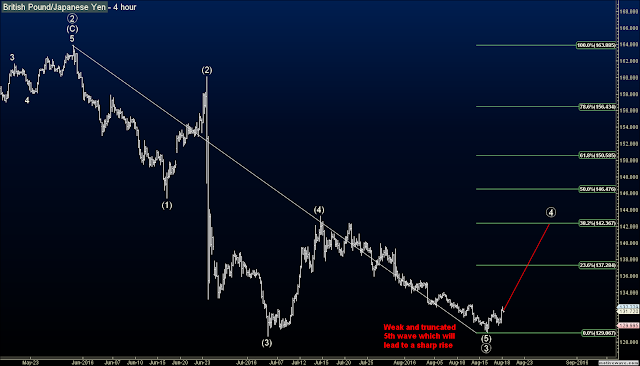
The British pound took off just like I projected, and the GBPJPY and GBPNZD were nice mediums to use to take advantage of this rise.  I entered the GBPJPY at 131.72, and it is sitting at 137.00 right now, and since I'm still long the GBPNZD I want to close the GBPJPY now to lock in profits.  The GBPJPY has outperformed the GBPNZD so far, and it is at the 23% Fibonacci retracement level, so it's possible it will take a pause here and let the GBPNZD catch up a bit.  Here is the result:

GBPJPY entry at 131.72 and close at 137.00 for 528 pip profit.


GBPNZD Chart

Speaking of the GBPNZD.... the rally is a complete mess, but is trending upward and still has room to move.  Fibonacci targets of resistance are at 1.83940 and 1.8549, although I still see hitting the 1.8600 - 1.8700 range before considering a top.  I entered long on this trade at 1.8061 and it is currently at 1.8216 so I'm at a respectable 155 pip profit, but don't want this to turn into a losing trade, especially after a nice profit on the GBPJPY.  So I'm moving my stop loss here to breakeven:

GBPNZD entry at 1.8061, moving a stop to breakeven at 1.8061

___________________________________________

PREVIOUS POST WITH ORIGINAL TRADE SETUP

British Pound - GBPJPY

British Pound - GBPNZD

The British pound has been getting pounded since Brexit but a bottom has been formed and a sharp rally is near. I have two confirmed buy signals on the daily charts, so a big trade is in order. The pairs with confirmed buy signals are the GBPJPY and the GBPNZD.

GBPJPY entry at 131.72 with profit target of 139.00
GBPNZD entry at 1.8061 with profit target of 1.8800

I only have catastrophic stop losses in for both as I want it to have room to run for the next few days or weeks without constantly getting stopped out from over-trading and overthinking the move higher.


Please support the blog and like this post :-)


PLEASE NOTE: THIS IS AN ELLIOTT WAVE BLOG EXPRESSING AN OPINION AND IN NO WAY GUARANTEES OR IMPLIES ANY PROFIT OR GAIN. TRADE AT YOUR OWN RISK.
Please support the blog and like this post :-)


PLEASE NOTE: THIS IS AN ELLIOTT WAVE BLOG EXPRESSING AN OPINION AND IN NO WAY GUARANTEES OR IMPLIES ANY PROFIT OR GAIN. TRADE AT YOUR OWN RISK.

Wednesday, August 24, 2016

Elliott Wave Stock Signals - Shorting UFPI

Shorting UFPI

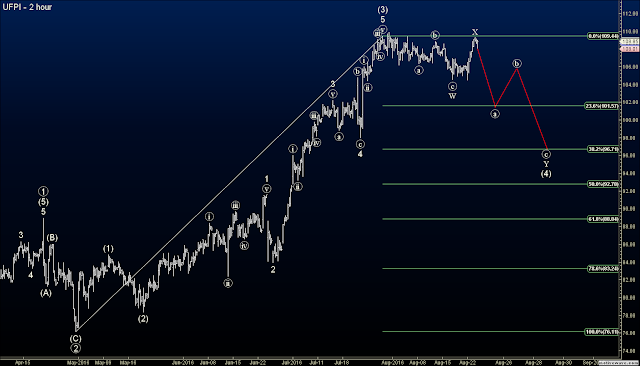
Universal Forest Products Inc. has had a hell of a run but is now stalling in a 4th wave correction. The test of the recent highs does not deter me, and I feel actually presents a nice shorting opportunity. Wave (4) is unfolding in a double combination correct with a target of $97, although I will probably get out closer to $100.  Here is the trade:

Buy UFPI Oct 21  110/95 put spread at $4.97


Please support the blog and like this post :-)


PLEASE NOTE: THIS IS AN ELLIOTT WAVE BLOG EXPRESSING AN OPINION AND IN NO WAY GUARANTEES OR IMPLIES ANY PROFIT OR GAIN. TRADE AT YOUR OWN RISK.
Thursday, August 18, 2016

British Pound Set to Soar

British Pound - GBPJPY

British Pound - GBPNZD

The British pound has been getting pounded since Brexit but a bottom has been formed and a sharp rally is near. I have two confirmed buy signals on the daily charts, so a big trade is in order. The pairs with confirmed buy signals are the GBPJPY and the GBPNZD.

GBPJPY entry at 131.72 with profit target of 139.00
GBPNZD entry at 1.8061 with profit target of 1.8800

I only have catastrophic stop losses in for both as I want it to have room to run for the next few days or weeks without constantly getting stopped out from over-trading and overthinking the move higher.


Please support the blog and like this post :-)


PLEASE NOTE: THIS IS AN ELLIOTT WAVE BLOG EXPRESSING AN OPINION AND IN NO WAY GUARANTEES OR IMPLIES ANY PROFIT OR GAIN. TRADE AT YOUR OWN RISK.
Thursday, August 11, 2016

Elliott Wave S&P Futures

S&P Futures

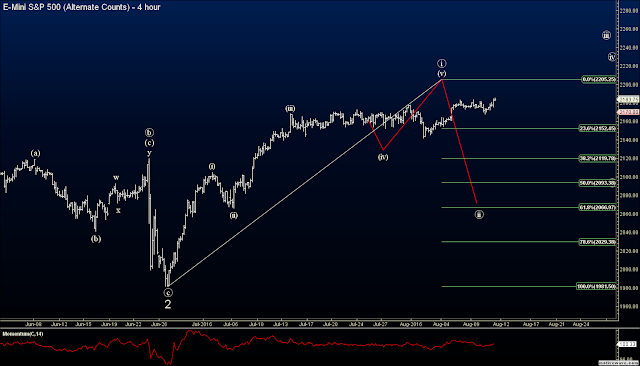
The market has followed my projected path (red lines more or less).  I don't think a top will occur until 2200 is hit. It's summer time and super slow so expect the market to float around for a few more weeks.  I do have confirmed short signals in the Nasdaq 100, Dow and S&P cash indexes on the 130 minute charts. But I don't think a decline will start until 2200 is tested. in the S&P futures.  I'll be back when something happens that matters.

Please support the blog and like this post :-)


PLEASE NOTE: THIS IS AN ELLIOTT WAVE BLOG EXPRESSING AN OPINION AND IN NO WAY GUARANTEES OR IMPLIES ANY PROFIT OR GAIN. TRADE AT YOUR OWN RISK.

Monday, August 1, 2016

Elliott Wave Options Signals - Closed NSP at 51% Profit

Closed NSP


NSP dropped 8% this morning after posting earnings so I closed my short position at a nice profit. NSP ended up dropping over 14% later in the trading day so in hindsight, my closure of this put spread was premature.  However, my trading strategy has rules in place for taking profits, and my profit target was hit at 8% drop level this morning, so I took profits then.  This profit level I use tends to act as a solid bounce point, sometimes permanent, so over the long run it will make more money to use it.  Here is the trade summary:

Sold to close NSP Aug 19  70/80 put spread at $6.25 
Bought at $4.13
Profit of $2.12, +51%

__________________
ORIGINAL TRADE SETUP...

Elliott Wave Option Signals - Short NSP

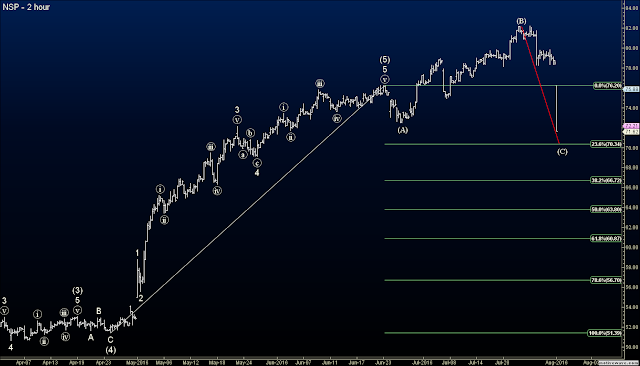
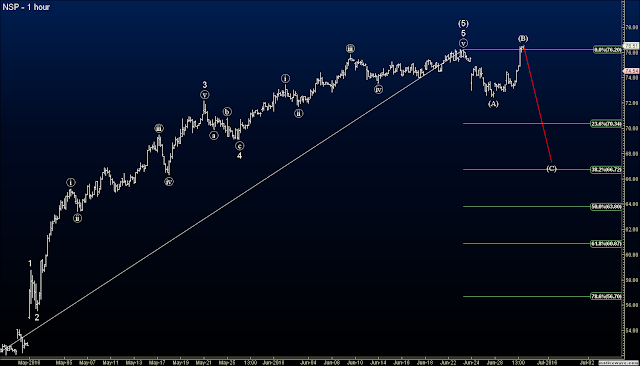
Insperity Inc. (NSP) has been on a huge monster rally the past several weeks but it has become quite choppy and is starting to roll over to the downside.  Today's sharp pop is just an exhaustion rally with the tired and tapped out bulls throwing everything they have at it today for one final push.  The next move of consequence should be to the downside.  I show a large Intermediate "flat correction" unfolding with today's rally part of wave (B) which should soon give way to a strong impulsive decline for wave (C) towards Fibonacci support at the $66.72 level (38% Fibo), which is also near the previous Minor wave 4, another typical draw for larger degree corrections.  So I went short with a put spread.  Here is the trade:

Buy to open NSP Aug 19  70/80 put spread at $4.13


Please support the blog and like this post :-)


PLEASE NOTE: THIS IS AN ELLIOTT WAVE BLOG EXPRESSING AN OPINION AND IN NO WAY GUARANTEES OR IMPLIES ANY PROFIT OR GAIN. TRADE AT YOUR OWN RISK.

Elliott Wave Options Signals - Closed NSP This Morning

Closed NSP


NSP dropped 8% this morning after posting earnings so I closed my short position at a nice profit.  Trade details to come shortly...

__________________
ORIGINAL TRADE SETUP...

Elliott Wave Option Signals - Short NSP

Insperity Inc. (NSP) has been on a huge monster rally the past several weeks but it has become quite choppy and is starting to roll over to the downside.  Today's sharp pop is just an exhaustion rally with the tired and tapped out bulls throwing everything they have at it today for one final push.  The next move of consequence should be to the downside.  I show a large Intermediate "flat correction" unfolding with today's rally part of wave (B) which should soon give way to a strong impulsive decline for wave (C) towards Fibonacci support at the $66.72 level (38% Fibo), which is also near the previous Minor wave 4, another typical draw for larger degree corrections.  So I went short with a put spread.  Here is the trade:

Buy to open NSP Aug 19  70/80 put spread at $4.13


Please support the blog and like this post :-)


PLEASE NOTE: THIS IS AN ELLIOTT WAVE BLOG EXPRESSING AN OPINION AND IN NO WAY GUARANTEES OR IMPLIES ANY PROFIT OR GAIN. TRADE AT YOUR OWN RISK.

Monday, July 25, 2016

Elliott Wave S&P Futures Signals

S&P Index Chart Signals

In my last post I projected a selloff the next day. The next day resulted in 8 S&P futures points being sold off. That is not nearly what I had expected.  However, the decline did not alleviate any of the bearish signals in place, on multiple time frames, and multiple different markets. And today the sell signals have spread to the S&P and Dow cash indexes on the 130 minute charts as you can see you above.

Elliott Wave S&P Futures Signals

My above wave count may be a bit aggressive. I think the market will go sideways and then rally somewhere surrounding the Fed announcement. That should mark the end of a five wave EWP rally.  

There are a lot of fibonacci levels on the above chart, but the important price levels are 2200 – 2207 which should cap the rally. Then I see the market declining to 2167 before potentially finding a bottom.

Please support the blog and like this post :-)


PLEASE NOTE: THIS IS AN ELLIOTT WAVE BLOG EXPRESSING AN OPINION AND IN NO WAY GUARANTEES OR IMPLIES ANY PROFIT OR GAIN. TRADE AT YOUR OWN RISK.
StatCounter