Thursday, April 1, 2010

Thrusting from the Triangle


The market decided to just thrust from the triangle this morning with a very sharp rise into about midday where it reversed nicely, only to be bought up at the close. Quite a see-saw day. The thrust in the morning is very typical of what to expect after a triangle, but is very short in length and time as it stands right now, even though it made a new high. The decline was much weaker and longer than the preceding rise and was bought up at the close, most likely because no one wants to hold short over a long weekend, especially with jobs data coming out tomorrow.

So to keep things in proper proportion and get the "right look", I'm labeling this morning's rally as a wave i within this final thrust upward. The midday decline was wave ii, and we're in wave iii right now. If correct, the market should shoot aggressively higher on Monday and take us to a possible test of 1200. But remember, thrusts are terminal moves that are immediately completely reversed when complete. So thrusts' sharp and fast nature shouldn't scare EW'ers, they should make us happy because we see opportunity.

A break below 1167.15 would mean the thrust ended today, and the market is in a larger correction, or has completely reversed trend in wave [3] or B. If the market shoots higher Monday above 1181.43, then I'd expect it to continue higher for a day or two and attempt to assault the 1200 level before topping and completely reversing to at least the apex of the triangle around 1171.


PLEASE NOTE: THIS IS JUST AN ANALYSIS BLOG AND IN NO WAY GUARANTEES OR IMPLIES ANY PROFIT OR GAIN. THE DATA HERE IS MERELY AN EXPRESSED OPINION. TRADE AT YOUR OWN RISK.

Wednesday, March 31, 2010

Sideways Action Suggests a Triangle is Unfolding


In reference to my least likely triangle count I put up yesterday I stated that, "If we don't get a decisive move tomorrow based on the above two counts, then this count will probably move up to be my top choice." Well today it looked like my top WXY count was well on track with "decisive drop", but as usual, the market was bought up from that dip and the market continues to go nowhere overall. But into the close there was more selling, putting the market back down near the lows. Today was the last day of the quarter, so some flip-flop was probably expected. Unfortunately, the sideways contracting nature of the market is looking more like a triangle, which I'm moving up to be my primary count, and the WXY count is my alternate count. Also the fact that the bullish 2nd count mentioned yesterday is looking very unlikely also lends itself to the triangle being a high probability at this point. Triangles only occur in 4th, X and B waves, and so this would mean we're in some degree of 4th wave. Once the triangle is complete, it will result in a thrust higher that should be sharp and strong, but then very quickly be completely reversed to at least the apex of the triangle. So the result of this triangle will result in a sharp rally and immediate complete reversal.

A break below 1165.77 would severely weaken this count, and a break below 1161.48 would cancel the triangle out altogether and put the WXY back as my top choice.


Alternate Count


My alternate count is the WXY combination correction I mentioned yesterday. It's pretty self-explanatory in that if this is correct it means we're in a wave c of Y down that should break to at least below the 1161.48 level before bottoming, but most likely will get to the low 1150s before doing so.


PLEASE NOTE: THIS IS JUST AN ANALYSIS BLOG AND IN NO WAY GUARANTEES OR IMPLIES ANY PROFIT OR GAIN. THE DATA HERE IS MERELY AN EXPRESSED OPINION. TRADE AT YOUR OWN RISK.
Tuesday, March 30, 2010

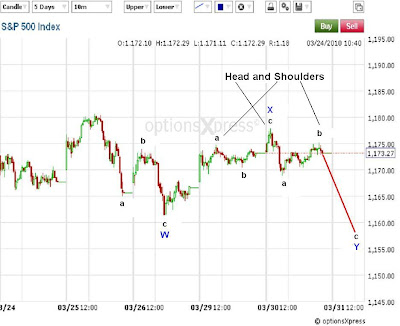
Market Probably Finishing up a Double Zig-zag

TOP COUNT: Double Zig-zag


The market did top last week, but unfortunately it has moved more sideways than down since that time. In doing so, it has allowed the internals of the market to "recharge" for perhaps another push higher. The top count this evening is a "double zig-zag" which is the result of two ABC corrections that collectively are labeled as WXY as you can see from the 10min S&P chart above. This count seems to make the most sense as I would think the market still should decline a bit further to alleviate the overbought condition and lack of momentum currently, along with the head and shoulders formation shown in the chart above. If correct, we should shoot downward in a strong wave C tomorrow to below 1161.48 to complete wave Y. From there, we will most likely find a bottom soon and rally to new highs on the year. If the market rallies strong tomorrow with good volume and strong NYSE internals, then the short term bears better go back into their caves and allow for the market to continue higher for the foreseeable future.


1st ALTERNATE: Bullish Count


Today's extension of the 5 wave rally higher made the nice 5 wave advance I labeled yesterday look a little more mutated today. This is why it has moved to second place on my list of probable counts. This count suggests a much more modest decline will occur tomorrow which will be followed by a roaring wave (iii) higher. If correct, then the rally should be accompanied with strong volume and and NYSE internals. So it might be wise to watch the amount of NYSE advancing stocks and volume sticks on the smaller time frames to see if strong buying interest is entering on a rally tomorrow becuase it will probably result in eliminating the short term bearish WXY correction mentioned above, and putting this bullish wave (iii) count as top choice.


2nd ALTERNATE: Triangle


The least likely count is the triangle scenario which would have us moving sideways in a tight range for another day or so before thrusting upward to a new high on the year. This is less likely simply because wave "b" is quite wide and makes it an awkward and therefore unlikely triangle. But no rules were violated so it remains a possibility. If we don't get a decisive move tomorrow based on the above two counts, then this count will probably move up to be my top choice.


PLEASE NOTE: THIS IS JUST AN ANALYSIS BLOG AND IN NO WAY GUARANTEES OR IMPLIES ANY PROFIT OR GAIN. THE DATA HERE IS MERELY AN EXPRESSED OPINION. TRADE AT YOUR OWN RISK.

Monday, March 29, 2010

3 Down, 5 Up, Caution to the Bears


Here is the chart from the morning that I was finally able to post.

I wanted to notify readers that today's break above 1173.93 makes the decline last week a 3 wave affair. In addition to that, the rally from the wave C low is a clear 5 wave rally. As a result, I will exit my short position soon. If last week's lows are broken then I'll reshort. If the market falls back a bit and does NOT break last week's lows, then I'll get long.

Nothing more really occured the rest of the day since I posted this in the morning. The market is overbought on many levels but is not falling. And the little decline it did do was an ABC three waver which makes it look like a correction since the 1173.93 level was exceeded on today's rally. So at this point, any further liklihood of a sustained decline is getting dim. The market needs to prove to me it wants to fall further to correct this overbought condition by getting below 1161, or forming small impulsive declines on the 3min or 5min charts. Since I'm not necessarily looking for "the top" at this point, it's possible the ABC decline I labeled above is just the first segment in a double or triple zig-zag. Which means the market will decline lower in a corrective fashion, but still work much lower from current levels.

The bottom line is that a break below 1161 would open the door for an assault on 1153 support, and a break above 1181 would target the 1200 level.


PLEASE NOTE: THIS IS JUST AN ANALYSIS BLOG AND IN NO WAY GUARANTEES OR IMPLIES ANY PROFIT OR GAIN. THE DATA HERE IS MERELY AN EXPRESSED OPINION. TRADE AT YOUR OWN RISK.

StatCounter