Friday, September 24, 2010

New Prechter Video on Rally (September 20th, 2010)

Video: Prechter On Market Rally

(Note: This interview was originally recorded on September 20, 2010)

In the video below, Robert Prechter talks to Yahoo! Finance Tech Ticker host Aaron Task and Henry Blodget about extreme readings in various indicators that confirm his bear-market forecast.


Get Up to Speed on Robert Prechter's Latest Perspective — Download this Special FREE Report Now.

Morning Update

With the market's decline from Tuesday looking corrective in some indices and the internals supporting that fact, today's rally looks like we'll be charging higher to new highs in the short term.  So we have to look at our next key levels.

As DH pointed out in my ELLIOTT WAVE FORUM, corrective waves often end at the prior fourth wave.  The prior fourth wave sits at 1173, and the 78.6% fibonacci retracement level (Elliott Wave Tutorial, 8.1) is just 8 points higher at 1181.  So to me, that seems like a good resistance area we can look for the market to struggle and perhaps top. 

In addition, according to Prechter and Frost's "Elliott Wave Principle: Key to Market Behavior", as a guideline, wave 2 usually retraces 66% to 81% of the preceding wave (p. 88).  If so, then the market is right in the reversal zone as we speak.  But with the strength shown today, I feel it will probably continue a bit higher into the upper end of that range at the 1173 - 1181 area before a top is reached.


While we may be looking for higher levels in the main indices, the S&P Small Caps, Russell, and XLF still sport nice bearish impulsive waves down with 3 wave corrections with some pausing at their 61.8% fibonacci levels (Elliot Wave Tutorial, 8.1).  So in these markets, EWP is unfolding perfectly.  Perhaps the main indices will push to new highs while these other markets/secotrs lag, creating a nice inter-market divergence into a major top.  We'll see.  In the short term though, the small caps and financials appear to be at some sort of top, whether it be short term or a major top.  We'll see how the action plays out the rest of the day. 

I'll post more later if more things develop.

So what do you think of these charts and my count?  Tell me in the ELLIOTT WAVE FORUM.  And don't be afraid to "let me have it" if you disagree.  I'm sure many of us would like a good discussion to help reinforce or answer questions about our current views.


PLEASE NOTE: THIS IS JUST AN ANALYSIS BLOG AND IN NO WAY GUARANTEES OR IMPLIES ANY PROFIT OR GAIN. THE DATA HERE IS MERELY AN EXPRESSED OPINION. TRADE AT YOUR OWN RISK.

Thursday, September 23, 2010

If a Top is in, it did it in "Stealth" Mode

PLEASE NOTE: Don't forget to tell me what you think about my analysis and the markets in the new ELLIOTT WAVE FORUM I just started up!  I'd love to here what you all think.


If the market put in a top on Tuesday it did so very quietly.  If a large wave 3 down is underway, as my wave count suggests, then I'd expect sharp downward moves, extremely bearish internals, and an increase in volume at least above the 1 billion share mark at a bare minimum.  We're getting none of that, so internally this market is not behaving like a wave 3 at all.............at least not yet.


ELLIOTT WAVE PRINCIPLE (LEARN IT FREE HERE)


The wave count above is unchanged from yesterday and remains on track as long as Tuesday's highs hold.  But until we see the breakdown of some key levels and a clear impulsive decline (Elliott Wave Tutorial, 2.1), we can't conclude with any amount of certainty that a top is in just quite yet.


The Above Russell 2000 chart and wave count is almost the exact same as the S&P 600 Small Cap index.  You can see that the small caps are showing weakness relative to the other main indices.  We all know that oftentimes the higher risk indices will lead the markets, so according to the small caps the overall market wants to move lower.  But the action in the small caps is a bit curious because the Nasdaq 100, also considered a risk index, is showing more strength relative to the other indices.  So we'll see soon enough who the true market leaders are.

So if we monitor the small caps, and even perhaps the Nasdaq Composite as shown below, we may see some signs of a top in already when we grind down to the smaller intraday charts.  The Russell  and S&P Small Caps both declined impulsively (Elliott Wave Tutorial, 2.1), and closed beneath their lows made this morning.  So if they're leading the market right now, the other indices should follow them lower tomorrow.


On the intraday Nasdaq Composite chart you can also count the decline impulsively as well, albeit it's not textbook.  Under this count, there should be little pops higher or sideways action tomorrow and Monday; it should just resume its decline sharply to new lows.  Anything else besides a sharp move lower would put this count into question.

ALTERNATE COUNT


Above is the alternate count (Elliott Wave Tutorial, 7.6) to intraday structure.  Here I'm illustrating this count in the Russell 2000.  This count remains quite probable since it would explain why the decline so far has been quite underwhelming in price and internal composition up to this point.  It also can account for the impulsive decline from Tuesday's highs as well, where it's just a wave A of a zig-zag (Elliott Wave Tutorial, 3.5) correction, with wave C now underway to carry just a little bit further down before a bottom is established.


The financials continue to follow my forecast originally pointed out in Tuesday's post.  The topping and reversal action was on the 4hr charts back then and I said it would probably lead to a decline for a few days, and it has done so nicely so far.  If we slap a wave count on this very bearish looking structure above we can see that its descent lower has just begun.  The XLF should not hesitate falling much lower in the coming days.  And remember, the XLF is one of the few markets that did not exceed its August 2010 high, creating a minor divergence with the major indices.  And that's bearish.

Keep your eyes on the bigger picture with EWI's newly posted article "Deflation: The Trend That's Become Too Obvious To Ignore."


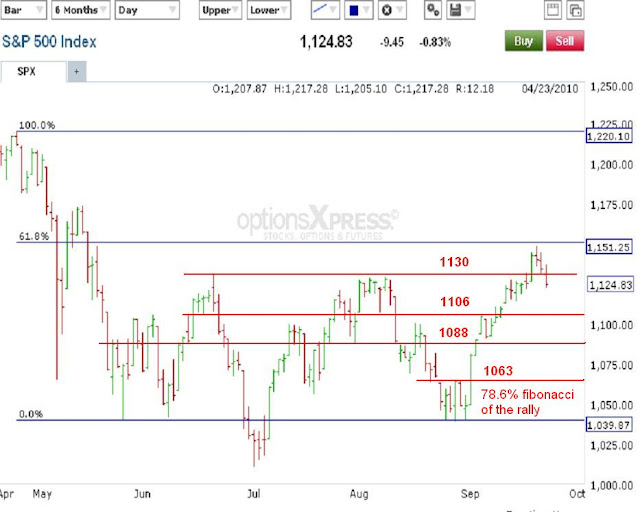
Key support levels to be taken out are 1130, 1106, 1088 and 1063.  Taking back 1130 today was important for the bears because this is the supposed "breakout" level that all the bulls have been talking about lately.  The break above 1130 was suppose to signal a breakout above the trading range of the past few months, implying much more upside potential in the weeks/months ahead.  But today the bears took back that level with a solid close back udnerneath it, perhaps signaling a "false breakout" to the upside earlier.  Now it's important is for the bears to hold onto this level Friday and early next week.

The next key levels at 1106 and 1088 are just prior support/resistance/congestion levels that could give the bears some problems.  The easier the bears take out these levels, the stronger it implies the downtrend is.  The ultimate key level is quite far away so I'm not sure how good it does us now to talk about it, but it lies at the 78.6% fibonacci level of the entire rise from late August at 1063.  A break below that level should prove that it would be too deep of a downward correction to confidently say that the larger trend is still up and the decline was just corrective.  Obviously, a break beneath 1039.70 will ultimately confirm that the larger downtrend had resumed and that a large and powerful wave 3 is in fact underway.  But we should have a better idea of that probability before the market approaches 1039.70.


One thing I've been watching lately is the action in the VIX.  The S&P should move in the opposite direction as the VIX.  But you'll notice that since around the middle of this month the VIX has been making higher lows in a minor uptrend while the S&P was making higher highs in an uptrend as well.  This shows an underlying fear and lack of confidence in those latter new highs in the S&P and lends itself to a top and reversal structure in stocks.


Lastly, I wanted to update the 4hr MACD chart on the S&P.  You can see with the weakness the past few days it has finally allowed the moving averages to cross down.  At their elevated level, it leaves lots of room to fall for a long time.  Another strong down close tomorrow should create a downward squeeze on the daily charts too, which would be another good sign for the bears.


Also, don't forget to take advantage of Prechter's August 2008 Theorist offered for free.  In this issue he does a question and answer format on the government's role in the economic conditions we find ourselves in.  Below are some of the questions he addresses in the newsletter:
  • What impact did the so-called “stimulus package” have on the U.S. economy?
  • In an economic depression, will pension funds keep most retired Americans afloat?
  • Who really benefits when the government props up Fannie Mae and Freddie Mac, and what's the fraud behind the idea of “too important” to fail?
  • Who does the government consider to be homeowners: you and your neighbors, or the banks that hold the deeds?
  • Who really endorsed the emergency Housing Act – and who will be hurt by it?
  • Can the Fed keep making loans to banks forever?
  • Is it actually against the law in some states to warn people of potentially dangerous banks?
  • GET IT RIGHT NOW FOR FREE HERE
PLEASE NOTE: THIS IS JUST AN ANALYSIS BLOG AND IN NO WAY GUARANTEES OR IMPLIES ANY PROFIT OR GAIN. THE DATA HERE IS MERELY AN EXPRESSED OPINION. TRADE AT YOUR OWN RISK.

Morning Update

PLEASE NOTE: I'm going to try to get a forum going to help increase the dialogue amongst viewers.  We'll see if it gains any traction here in the coming days.  So please visit the forum and post your thoughts and questions at the markets.  There will be a permanent link to the forum just above the most recent post.  Let's get it rollin!   ELLIOTT WAVE FORUM

Bob Prechter's Updated Deflation eBook is now available for free at EWI.  With the mainstream media and the Federal Reserve catching up to the dangers of deflation, now is an excellent time to view this free resource.  Prechter's 90-page eBook teaches how to prepare for deflation and adapt during it, but also learn how to survive it and -- most important -- prosper during it, so people can be ready for the buying opportunity of a lifetime at its end.   Check it out here for free.


The decline from the Tuesday high so far looks corrective.  A break above 1137.22 will really make it look like a 3 wave drop, correction (Elliott Wave Tutorial, 3.4).  If so, a break to a new high on the week is imminent.  Also, the Nasdaqs are leading the charge higher and the NDX almost made a new high on the week with the Composite following closely behind.  Also, the British pound made a new high cancelling out the 5 wave drop I mentioned in yesterday's post, yet now the euro is struggling.  But there's no compelling evidence to suggest a top in these two currencies, which means a US dollar bottom MAY not be upon us quite yet.  And lastly, the internals and strength of the decline fit more of a correction, not a reversal in trend......at least not yet.  I'd expect much stronger selling with much more bearish internals than what we're seeing right now if a top was in.

However as I've said before, if the indices do get to new highs on the week, they should not be long lived.


ELLIOTT WAVE PRINCIPLE (LEARN IT FREE HERE)


But all is not so bullish.  The Russell 2000, the S&P 600 Small Caps and the XLF are still showing weakness relative to the major indices, and they all sport nice 5 wave impulsive declines (Elliott Wave Tutorial, 2.1) unlike the S&P, Dow and Nasdaqs.  So it's possible the S&P, Dow and Nasdaqs MAY make new highs on the week while these secondary indices lag and don't make new highs.

So we'll see what develops the rest of the day.  More later....


Also, don't forget to take advantage of Prechter's August 2008 Theorist offered for free.  In this issue he does a question and answer format on the government's role in the economic conditions we find ourselves in.  Below are some of the questions he addresses in the newsletter:
  • What impact did the so-called “stimulus package” have on the U.S. economy?
  • In an economic depression, will pension funds keep most retired Americans afloat?
  • Who really benefits when the government props up Fannie Mae and Freddie Mac, and what's the fraud behind the idea of “too important” to fail?
  • Who does the government consider to be homeowners: you and your neighbors, or the banks that hold the deeds?
  • Who really endorsed the emergency Housing Act – and who will be hurt by it?
  • Can the Fed keep making loans to banks forever?
  • Is it actually against the law in some states to warn people of potentially dangerous banks?
  • GET IT RIGHT NOW FOR FREE HERE
PLEASE NOTE: THIS IS JUST AN ANALYSIS BLOG AND IN NO WAY GUARANTEES OR IMPLIES ANY PROFIT OR GAIN. THE DATA HERE IS MERELY AN EXPRESSED OPINION. TRADE AT YOUR OWN RISK.

Wednesday, September 22, 2010

All Eyes Looking on for a Stock Market Top: Currencies also Setting up Nicely for the Bears

Bob Prechter's Updated Deflation eBook is now available for free at EWI.  With the mainstream media and the Federal Reserve catching up to the dangers of deflation, now is an excellent time to view this free resource.  Prechter's 90-page eBook teaches how to prepare for deflation and adapt during it, but also learn how to survive it and -- most important -- prosper during it, so people can be ready for the buying opportunity of a lifetime at its end.   Check it out here for free.

And don't forget to check out my midday post, "Midday Update - Risk Still Pulling Back", if you missed it.


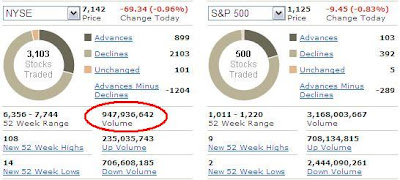
The internals today were modestly bearish with the exception that volume remains fairly light still with 953 million shares traded on the NYSE.  We had a break above the 1 billion share market yesterday, but today we're right back to the upper end of the slow volume range we've been at for several weeks.  It's possible a major top was registered yesterday, and the uptick in volume then helps contribute to that thesis, and today's slight decrease in volume may be because the market was correcting the sharp late day selloff from yesterday.  We'll have to see.  But it's clear that the internals of the market are not showing signs of strength at the moment, and when you add the fact that the higher risk indices are showing more weakness relative to the lower risk indices like I mentioned in my previous posts, then you have the signs of a market topping.

ELLIOTT WAVE PRINCIPLE (LEARN IT FREE HERE)


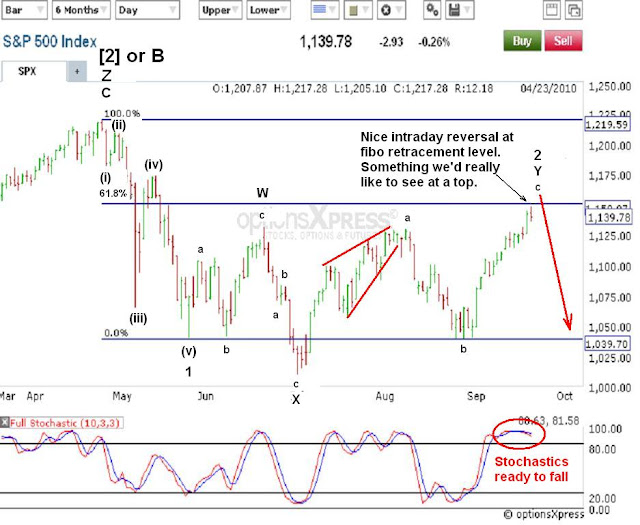
The S&P daily chart shows that after wave 1 down was complete in late May, the market has been undergoing a long and complex "combination" correction labeled WXY (Elliott Wave Tutorial, 5.1).  Yesterday's high and reversal occurred at a good level for the bears at the 61.8% fibonacci level, a common retracement level for 2nd waves (Elliott Wave Tutorial, Section 8).

Also notice that the daily stochastics are starting to trend down with plenty of room to run from overbought territory.  The bearish potential from current levels, with a stop just above yesterday's highs, remains a good trading opportunity for the bears to risk little and possibly gain a whole lot.


You can also see that the XLF picture I laid out yesterday with the 4hr chart proved to be a good indicator of future movement since the XLF declined 1.63% today, significantly more than the blue chip indices.  The decline comes right after it fell short of breeching its early August high which keeps the 5 wave decline intact, and the larger trend pointed down.  Again this could be another great trading opportunity for the bears with a stop just above the August high and plenty of room to run on the downside if that high remains intact.

With the XLF in full bear mode at the moment, it paints a bearish picture for the stock market as a whole since I highly doubt the stock market can sustain any meaningful rally without financials participating.


RUSSELL 2000 and S&P 600 SMALL CAP DIVERGENCE


While many market divergences have been erased with this week's rally, some still remain in place.  For instance, the XLF and the S&P Small Cap index have not exceeded their July/August highs with the rest of the market.  But in comparing apples-to-apples, the S&P Small Cap's failure to make a new high is in conflict with the Russell 2000's new high made yesterday.  So the small caps are mixed, and the financials and the S&P are mixed.  This type of behavior doesn't mean tell us for certain that a stock market top is in, as we've sure learned the past couple weeks, but if a top is in fact in then this is the type of divergent behavior we'd like to see.

CURRENCIES (EWI FOREX SERVICES)


The daily euro count paints a very bearish picture ahead. The currency is currently in a wave C of 2 that should be wrapping up shortly (Elliott Wave Tutorial, 7.2, number 2).  Although wave 2 does not appear complete on the smaller timeframes, it can finish at any time, and there's evidence to support that. 

For instance, the Daily RSI as charted above is at levels that it's achieved near tops in the past as you can see by the green markings on the above chart.  Although the previous tops have been much smaller than what this wave count suggests, it still shows that the current extreme in the RSI is when price tends to top and reverse.  And with the wave count projecting a large wave 3 about to start, any possible topping signs we get demands our attention.

This wave count and setup also coincides well with what's expected in stocks.  The euro and stocks tend to move quite correlated to each other.  And so it's encouraging to see two very bearish wave counts and setups in both equities and the euro at the same time.


Lastly, I just wanted to show the divergence in place between the British pound and euro agains the US dollar.  You can see that the euro has been on fire lately and has well exceeded its August high along with most equity indices.  However the British pound not only has not confirmed this new high in the euro, but also has not confirmed the euro's new September high it just put in, and has recently declined in a nice 5 wave impulse pattern (Elliott Wave Tutorial, 2.1) as discuess in today's midday post.  See GBP/USD chart here.

So even currencies are setting up for a big fall, which in this case means a massive US dollar rally. 

So the setups in the markets are there, we just need to wait for them to play out.  The key for the bears is to soon get a sharp impulsive decline with a strong increase in volume to break down key levels which I'll discuss when the decline gets underway.  Any continuation higher the rest of the week should just be temporary, and may mean a challenge of the 78.6% fibonacci retracement level surrounding 1180 in the S&P.


Also, don't forget to take advantage of Prechter's August 2008 Theorist offered for free.  In this issue he does a question and answer format on the government's role in the economic conditions we find ourselves in.  Below are some of the questions he addresses in the newsletter:
  • What impact did the so-called “stimulus package” have on the U.S. economy?
  • In an economic depression, will pension funds keep most retired Americans afloat?
  • Who really benefits when the government props up Fannie Mae and Freddie Mac, and what's the fraud behind the idea of “too important” to fail?
  • Who does the government consider to be homeowners: you and your neighbors, or the banks that hold the deeds?
  • Who really endorsed the emergency Housing Act – and who will be hurt by it?
  • Can the Fed keep making loans to banks forever?
  • Is it actually against the law in some states to warn people of potentially dangerous banks?
  • GET IT RIGHT NOW FOR FREE HERE

PLEASE NOTE: THIS IS JUST AN ANALYSIS BLOG AND IN NO WAY GUARANTEES OR IMPLIES ANY PROFIT OR GAIN. THE DATA HERE IS MERELY AN EXPRESSED OPINION. TRADE AT YOUR OWN RISK.

Midday Update - Risk Still Pulling Back

Don't forget to take advantage of EWI's FreeWeek for commodities.  If anything, it's a good EWP learning tool with real time counts and analysis.  You can see more of the logic and resaoning behind devloping viable wave counts.  It's available until September 23, 2010.


ASIA AND EUROPE SELLOFF AND THE END OF TRADING


Above I posted some Asian and a Europe chart to show the end of day weakness we can see in the major indices.  There are more but I didn't post them all here as I didn't feel it necessary.  So seeing as that these markets weren't overly excited at the Fed announcement yesterday, and actually sold off at the end of trading, it's possible the US will follow suit today.  Just something to keep in mind as we watch the action into the close.


To add to yesterday's post where I talk about risk pulling back after the Fed announcement we have continuation of that trend today.  You can see that the higher risk indices are well exceeding the blue chip Dow and even S&P's declines.  Although not shown, the XLF which I went into detail yesterday about its bearish implications this week, is down 1.67% at the time of writing this. 

So this is the type of risk averse behavior we'd like to see if a major top is forming.  Keep in mind the evidence I laid out in yesterday's post on the wave count and fibo retracement level (EWI tutorial section 8) the S&P reached and reversed at, along with the slew of other evidence the past few days that support the idea that a top forming.  And it may already be in.  Volume is a bit light today though, so that's not what I'd expect if a major top is in and the trend is changing to down, but the internals are still solidly bearish regardless.

US DOLLAR (ELLIOTT WAVE CURRENCY ANALYSIS)


Normally I follow the euro vs. the US dollar for the outlook on the US dollar's status but the euro is in a straight line up at the moment and I see nothing bearish about its structure yet.  So usually turn to other pairs to look for dollar action, such as the British pound which has quite a nice bearish setup at the moment vs. the US dollar. 

The British pound is not showing the strength against the dollar that the euro is, and you can see that the pound made a nice 5 wave decline recently and the start of that 5 wave decline has not yet been exceeded.  Now the correction is quite strong and deep so that's a bit concerning, but it's quite possible that it's a wave 2 since it has those characteristics and hasn't exceeded the start of the first wave down (EWI Tutorial, Section 7.1).  Then you see at the top of the recent rally that there's been a lot of volatility there, which could also be part of a topping structure. 

The risk/reward here for the British pound bears is phenomenal since one could enter short now and put a stop just above 1.5728 with the potential to make much more than what's risked.  To learn more about entry and stop levels using Elliott Wave Principle, check out EWI's free report on the subject.

I'll post some follow-up stuff after the closing bell.

In light of the Fed's announcement today I thought I'd post the offer for Prechter's August 2008 Theorist for free.  In this issue he does a question and answer format on the government's role in the economic conditions we find ourselves in.  Below are some of the questions he addresses in the newsletter:
  • What impact did the so-called “stimulus package” have on the U.S. economy?
  • In an economic depression, will pension funds keep most retired Americans afloat?
  • Who really benefits when the government props up Fannie Mae and Freddie Mac, and what's the fraud behind the idea of “too important” to fail?
  • Who does the government consider to be homeowners: you and your neighbors, or the banks that hold the deeds?
  • Who really endorsed the emergency Housing Act – and who will be hurt by it?
  • Can the Fed keep making loans to banks forever?
  • Is it actually against the law in some states to warn people of potentially dangerous banks?
  • GET IT RIGHT NOW FOR FREE HERE

PLEASE NOTE: THIS IS JUST AN ANALYSIS BLOG AND IN NO WAY GUARANTEES OR IMPLIES ANY PROFIT OR GAIN. THE DATA HERE IS MERELY AN EXPRESSED OPINION. TRADE AT YOUR OWN RISK.

Tuesday, September 21, 2010

Nice Reversal Today, XLF Makes it Look Promising for the Bears, Wave 2 Might have Topped

Don't forget to take advantage of EWI's FreeWeek for commodities.  If anything, it's a good EWP learning tool with real time counts and analysis.  You can see more of the logic and resaoning behind devloping viable wave counts.  It's available until September 23, 2010.


Today's internals show a kink in the armor in the beloved bulls rally.  Today the sellers dominated internally as you can see from the NYSE and S&P data above, although price didn't reflect it very well as they only closed modestly down for the day.  What's good to see for the bears is the slight uptick in volume with today's reversal down day.  Shares finally broke above the 1 billion share mark on the NYSE which has been a very difficult task for the bulls to do, but all too common for the bears to do.  This is a very bearish sign in my view.


ELLIOTT WAVE PRINCIPLE


Above you can see a daily S&P wave count that is very mature and at, or near, a top.  Today's action leaves a nice setup for a reversal in trend to the downside.  You can see that wave 2 has been a very prolonged WXY "Combination" correction (EWI Tutorial, Section 5.1).  Wave C of Y fell about 1 point shy of hitting the key 61.8% fibonacci retracement level at 1150 before sharply reversing today.  This could be a very bearish development, and looking at the other evidence accompanying the reversal today, it looks promising.  If not, the market may try to charge higher toward the 78% fibo retracement level around the 1180 area.


The bullish swing traders on the XLF have to be nervous right now.  There are several signs that this baby has topped and is headed lower in the coming days, if not weeks.  It's overall weakness relative to the indices I follow and discuss here is quite noticable at this point. 

First you can see that the XLF is the only one that has not been able to exceed its August high.  Also notice on this 4hr chart there's a nice reversal bar formed at the end of the day.  You can see that it made a new high above the previous bar, and then reversed to close beneath the previous bar's intraday low.  That produces bearish implications for the financial sector in the coming days if that bar's high holds at 14.91.  Also notice the MACD histogram is "squeezing" down, signaling a cross down in the moving averages is coming.  And when you combine that with the other two things I just mentioned, it doesn't look good for the XLF in the coming days.  And a falling financial sector probably means a falling stock market. 

Don't forget that EWI's free 50 page Ultimate Technical Analysis Handbook is still available until tomorrow, September 22, 2010.  It discusses in detail some basic technical analysis methods that may supplement your trading.  If anything, just download it now to ensure you get it and then check it out at a later date.  You can never have enough free tools in the trading toolbox if you ask me.


RISK IS FINALLY PULLING BACK


Above you can see a series of charts, starting with the S&P, Nasdaq 100, Russell 2000 small caps and the XLF financial ETF.  The S&P and Dow did not make new lows at the end of the day, however all the other indices listed did make new lows.  What's interesting here is that during this whole rally the past few weeks, it's the Nasdaqs and the Russell 2000 have been leading the charge higher by well exceeding the S&P and Dow's gains almost everyday of the rally.  Now today they exceeded the Dow and S&P to the downside and even made new lows.  So this might be a signal in trend change occurring here since the riskier assets led the charge lower today.

So the setup is nice again for the bears to come in and takeover this market.  If the market hasn't topped today, it should do so very soon.  1180 should provide strong resistance if the market finds a way to chug higher.


In light of the Fed's announcement today I thought I'd post the offer for Prechter's August 2008 Theorist for free.  In this issue he does a question and answer format on the government's role in the economic conditions we find ourselves in.  Below are some of the questions he addresses in the newsletter:
  • What impact did the so-called “stimulus package” have on the U.S. economy?
  • In an economic depression, will pension funds keep most retired Americans afloat?
  • Who really benefits when the government props up Fannie Mae and Freddie Mac, and what's the fraud behind the idea of “too important” to fail?
  • Who does the government consider to be homeowners: you and your neighbors, or the banks that hold the deeds?
  • Who really endorsed the emergency Housing Act – and who will be hurt by it?
  • Can the Fed keep making loans to banks forever?
  • Is it actually against the law in some states to warn people of potentially dangerous banks?
  • GET IT RIGHT NOW FOR FREE HERE


PLEASE NOTE: THIS IS JUST AN ANALYSIS BLOG AND IN NO WAY GUARANTEES OR IMPLIES ANY PROFIT OR GAIN. THE DATA HERE IS MERELY AN EXPRESSED OPINION. TRADE AT YOUR OWN RISK.

Monday, September 20, 2010

Mud

Just a note for Tues. - Thurs., I'll be on the road for meetings during that time and I'm unsure how much time I'll have for posts during those days but I'll do my best to get the core info I see out to you all during that time.

Well I feel like my name is Mud since I've truly underestimated the potential of this rally.  I've been wrong several times in the past few days and I've suffered a lot of trading pain because of it.  However, as I said in previous posts when I started getting short again, I wanted to use short term put options because I thought I knew that the market would top and reverse within a short period of time, yet I really wasn't sure where the mak- or-break point was for price.  So I bought options to have a set risk amount I was comfortable losing if the market didn't turn.  But no one likes to lose and I hate being wrong. 

With that said, I still remain bearish for the outlook in the coming days.  The market is in a "panic buy" mode in my view and that is the type of behavior I'd expect to see going into a major high, not at the start of a major low being formed after a monster rally that started back in March 2009.  If the market had declined 50% and then started to rally with the current structure we see now, I might think more bullish.  But within the larger context of the market and the wave count of this monster rally from March 2009, I see this current panic buy behavior as a sharp aggressive move into a top.

Again I'll refer follks to EWI's article regarding the bigger picture of stocks titled 3 Reasons Now is Not the Time to Speculate in Stocks.  It helps put things in perspective, especially those long term investment folks who might feel a bit defeated after this rally.

INTERNALS


The internals today were very strong, especially in regards to up volume vs. down volume.  Advancers vs. decliners in the NYSE were quite strong but not as much as I'd expect if we were in some kind of wave 3 if we're to assume the market is back in bull mode again.  The strength and depth of this rally would suggest that it most likely would be part of a wave 3 at some degree, so I'd expect to see internals that coincide with that.  And most importantly, I'd expect to see those stellar numbers in conjuction with high volume, which you can see again stayed well below even the 1 billion share mark.  A solid volume number would be in the 1.4 billion or above area.  So again, although the few folks participating in the rally are almost all bullish, overall there is little mass market interest on the long side.  This is typical of a countertrend move.  But unfortunately, that behavior can continue for extended periods of time.


ELLIOTT WAVE PRINCIPLE


Folks trying to trade the ins and outs of this market might find use of EWI's current free resource titled "Learn How the Wave Principle Can Improve Your Trading".  This document discusses entry levels and risk managmeent through appropriate stop levels to the current wave count. 

Above is a shot at a wave count that seems to be only real viable bearish option left that would explain the current behavior of the market.  Judging by the strength and unrelenting nature of the current rally, I'm assuming it's part of a wave C.  According to EWI's tutorial, "Advancing 'C' waves within upward corrections in larger bear markets are just as dynamic [as declining 'C' waves] and can be mistaken for the start of a new upswing, especially since they unfold in five waves (section 7.3, number 8).  Wave C's are often very similar looking and feeling to wave 3's only that wave C's are part of a larger correction, and often finish that larger correction.  According to that description, the rally from August 27, 2010 lows sure feel like a wave C.  So that's one of the reasons why I think the above count makes sense. 

Above we can see the fibonacci retracement levels (EWI tutorial secion 8) for wave 2.  As a guideline, wave 2's are often quite deep corrections that can easily retrace to the 61% or 78% fibonacci levels which are at the 1150 and 1180 levels.  The current environment surely coincides to both a wave C, and a wave 2 to which that wave C lies.  EWI's tutorial states that, "Second waves often retrace so much of wave one that most of the advancement up to that time is eroded away by the time it ends.... At this point, investors are thoroughly convinced that the [bull] market is back to stay (section 7.2, number 2).  Well I don't know about you, but the recent market action, sentiment, and social mood I feel now is that of thinking the resumption of the uptrend that started March of 2009 is now underway.  So here two the action the past few weeks also fits farily well with a large wave 2.  If so, we just need to wait for this wave C of 2 to complete its subdivisions into a top so we can watch the wave 3 destruction get ahold of this market.  If the market continues higher, I think the 1150-1180 could provide so solid resistance.

LESS LIKELY BULLISH ALTERNATE COUNT


Without considering the larger long term wave count or the accompanying mood and momentum behind the current rally, we can just look at a daily chart and see that it's possible that a 3 wave corrective decline occurred from this year's highs, and the rally from the July 1, 2010 lows is the start of an impulse rally to new highs on the year.  But when considering the wave personalities I mentioned above with my bearish preferred count along with volume, sentiment and momentum characteristics, this count does not appear likely.  But I wanted to show this count so people will at least see the possible bullish potential of this market and can at least be aware of it as we move forward in the coming days/weeks.


To illustrate the overbought momentum I eluded to earlier I wanted to show the daily stochastics for the S&P.  You can see that they're well in overbought territory and poised to fall at any time.  There are various intraday charts showing oversold and diverging downward behavior as well.  As we now well know, these momentum indicators are not good timing methods, but they do show the current momentum potential and possible wave count potential that may coincide with it.

More free technical analysis stuff to take advantage of here as EWI's Senior Tutorial Instructor Jeffrey Kennedy gives you practical lessons -- free.


Lastly, the daily RSI shows it's approaching overbought territory.  Of all the momentum indicators out there, I hold the RSI as the most reliable, especially on the daily charts and bigger.  On many intraday charts, there's a clear bearish divergence occurring suggesting that the move is overextended, and the longer the divergence remains in place, the sharper and harder the market should fall.  Looking at the daily chart we don't see a divergence, but we do see an approach into overbought territory.  If the market can actually make the RSI get above the overbought level, and price is not close to making a new high on the year, then I would take that as another bearish sign for the market.  So I'll be tracking this one closely. 

If your'e interested in learning more basic technical analysis methods, check out the free Ultimate Technical Analysis Handbook.

The market was quite strong today and closed near its highs so there may be continuation tomorrow.  The key now is to look for a sharp intraday reversal in the market, preferably near key levels like the 1150 or 1180 fibo levels I mentioned earlier, along with a nice increase in volume.  Until then, I remain patient for the market to fall as I continue to endure the pain it's causing to my account.

PLEASE NOTE: THIS IS JUST AN ANALYSIS BLOG AND IN NO WAY GUARANTEES OR IMPLIES ANY PROFIT OR GAIN. THE DATA HERE IS MERELY AN EXPRESSED OPINION. TRADE AT YOUR OWN RISK.

StatCounter