Today's internals show a kink in the armor in the beloved bulls rally. Today the sellers dominated internally as you can see from the NYSE and S&P data above, although price didn't reflect it very well as they only closed modestly down for the day. What's good to see for the bears is the slight uptick in volume with today's reversal down day. Shares finally broke above the 1 billion share mark on the NYSE which has been a very difficult task for the bulls to do, but all too common for the bears to do. This is a very bearish sign in my view.
ELLIOTT WAVE PRINCIPLE
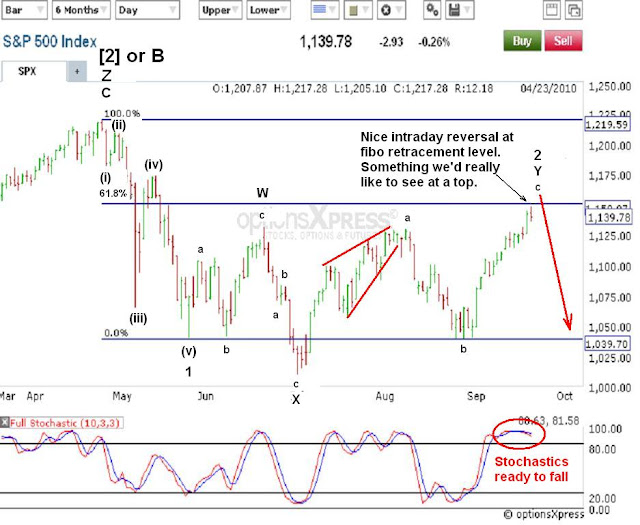
Above you can see a daily S&P wave count that is very mature and at, or near, a top. Today's action leaves a nice setup for a reversal in trend to the downside. You can see that wave 2 has been a very prolonged WXY "Combination" correction (EWI Tutorial, Section 5.1). Wave C of Y fell about 1 point shy of hitting the key 61.8% fibonacci retracement level at 1150 before sharply reversing today. This could be a very bearish development, and looking at the other evidence accompanying the reversal today, it looks promising. If not, the market may try to charge higher toward the 78% fibo retracement level around the 1180 area.
The bullish swing traders on the XLF have to be nervous right now. There are several signs that this baby has topped and is headed lower in the coming days, if not weeks. It's overall weakness relative to the indices I follow and discuss here is quite noticable at this point.
First you can see that the XLF is the only one that has not been able to exceed its August high. Also notice on this 4hr chart there's a nice reversal bar formed at the end of the day. You can see that it made a new high above the previous bar, and then reversed to close beneath the previous bar's intraday low. That produces bearish implications for the financial sector in the coming days if that bar's high holds at 14.91. Also notice the MACD histogram is "squeezing" down, signaling a cross down in the moving averages is coming. And when you combine that with the other two things I just mentioned, it doesn't look good for the XLF in the coming days. And a falling financial sector probably means a falling stock market.
Don't forget that EWI's free 50 page Ultimate Technical Analysis Handbook is still available until tomorrow, September 22, 2010. It discusses in detail some basic technical analysis methods that may supplement your trading. If anything, just download it now to ensure you get it and then check it out at a later date. You can never have enough free tools in the trading toolbox if you ask me.
RISK IS FINALLY PULLING BACK
Above you can see a series of charts, starting with the S&P, Nasdaq 100, Russell 2000 small caps and the XLF financial ETF. The S&P and Dow did not make new lows at the end of the day, however all the other indices listed did make new lows. What's interesting here is that during this whole rally the past few weeks, it's the Nasdaqs and the Russell 2000 have been leading the charge higher by well exceeding the S&P and Dow's gains almost everyday of the rally. Now today they exceeded the Dow and S&P to the downside and even made new lows. So this might be a signal in trend change occurring here since the riskier assets led the charge lower today.
So the setup is nice again for the bears to come in and takeover this market. If the market hasn't topped today, it should do so very soon. 1180 should provide strong resistance if the market finds a way to chug higher.
In light of the Fed's announcement today I thought I'd post the offer for Prechter's August 2008 Theorist for free. In this issue he does a question and answer format on the government's role in the economic conditions we find ourselves in. Below are some of the questions he addresses in the newsletter:
- What impact did the so-called “stimulus package” have on the U.S. economy?
- In an economic depression, will pension funds keep most retired Americans afloat?
- Who really benefits when the government props up Fannie Mae and Freddie Mac, and what's the fraud behind the idea of “too important” to fail?
- Who does the government consider to be homeowners: you and your neighbors, or the banks that hold the deeds?
- Who really endorsed the emergency Housing Act – and who will be hurt by it?
- Can the Fed keep making loans to banks forever?
- Is it actually against the law in some states to warn people of potentially dangerous banks?
- GET IT RIGHT NOW FOR FREE HERE
PLEASE NOTE: THIS IS JUST AN ANALYSIS BLOG AND IN NO WAY GUARANTEES OR IMPLIES ANY PROFIT OR GAIN. THE DATA HERE IS MERELY AN EXPRESSED OPINION. TRADE AT YOUR OWN RISK.


2 comments:
Great post, I agree I think XLF is key.
To me it looks like a FLAT has formed on XLF, from July 2 - Sept 21: I'm assuming that wave 3/or C should follow.
Thanks again for the posts
My pleasure.
The XLF is followed through to the downside nicely today, as forecast. I'd like to keep an eye on it since I feel continued weakness in the sector will spill over to the overall stock market if it continues.
Post a Comment