Tuesday, December 29, 2009

Dollar Decline was a 4th Wave; 5th Wave to New Highs Coming Soon


In earlier posts I said that the US dollar should retreat deep in a wave 2 correction before charging higher. Today's action makes me think that I was wrong. Observe my attached EUR/USD 1hr chart; it shows that today's break beneath 1.4349 makes the entire rise from 1.4216 a completed 3 wave affair. Also, if you look at the attached 8hr chart of the EUR/USD, the "right look" guideline of EWP also applies well to this current posted count that the recent really was just a 4th wave, with a 5th wave to new lows on the horizon.

Now it's possible the EUR/USD is in an X wave right now, and will rally again in an A-B-C fashion to complete a "double zig-zag" correction. So if I were to short the EUR/USD, I would place a stop loss just above the wave C high of 1.4458. However I don't think this will happen for two reasons: 1) notice the power and speed of the current decline to beneath the wave B lows in the 1hr EUR/USD chart. It appears that the strong downtrend over the past few weeks has resumed, and that it's a bit too strong to be an X wave, which is a countertrend wave; and 2) as you can see from the attached GBP/USD 1hr chart, this pair has already made a new low suggesting that in fact the downtrends in dollar pairs have resumed.

I personally am not trading the dollar right now as the risk of a huge and strong snap back wave 2 is too high, so I have no position in any dollar pairs yet. I'm going to wait until I can catch the wave 2 move, which should be quite deep. Also, the Dow rallied above the key level I cited earlier which negates the 5 wave decline I illustrated several times. Until the holidays pass, and volume re-enters the markets, equities should continue to float sideways or higher.

I hope you all are enjoying your holiday season; I'll be back when something significant develops.

Cheers!


PLEASE NOTE: THIS IS JUST AN ANALYSIS BLOG AND IN NO WAY GUARANTEES OR IMPLIES ANY PROFIT OR GAIN. THE DATA HERE IS MERELY AN EXPRESSED OPINION. TRADE AT YOUR OWN RISK.

Thursday, December 24, 2009

Euro/US Dollar Correcting Upward


The dollar's trend has changed to down for the short term. I attached the chart of the euro vs. the US dollar, which basically moves opposite the to the US Dollar Index. The EUR/USD is sporting a clear 5 wave rally. Most likely it's a wave A in at least an A-B-C correction. I'm waiting for it to reach the 1.4540 - 1.4700 range I mentioned yesterday before I start shorting the EUR/USD. But, because the rally off 1.4216 is in 5 waves, it cannot be a "flat correction", therefore if the pair breaks below 1.4216 then that would hint that the downtrend in the EUR/USD has continued and that it should fall much further. So currently I have a "sell stop" order placed at 1.4210 so I can catch a collapse if it occurs. Aggressive traders can look to go long the EUR/USD right now with a stop below 1.4216, however I don't recommend that. The EUR/USD downtrend is too strong to play against it in my view. I'm merely looking for opportunities to get long the US dollar by buying the USD/CHF and shorting the EUR/USD, AUD/USD and GBP/USD.

In summary, I currently have a "sell stop" order on the EUR/USD at 1.4210, but will remove that order and start getting short the EUR/USD immediately once it enters my resistance range of 1.4540 - 1.4700.


PLEASE NOTE: THIS IS JUST AN ANALYSIS BLOG AND IN NO WAY GUARANTEES OR IMPLIES ANY PROFIT OR GAIN. THE DATA HERE IS MERELY AN EXPRESSED OPINION. TRADE AT YOUR OWN RISK.

Wednesday, December 23, 2009

Dow Running out of Room to Rally and Keep Impulsive Bearish Decline Intact


The Russell 2000 index made a new daily high, confirming the other indices' new highs, which is very disappointing for the bears. The fracturing of the market was quite deep and with various indices and sectors a few weeks ago, but the Dow Utilities and Transports, and now the Russell 2000 have all confirmed the highs of the Dow, S&P and Nasdaq. The only main lagger is the financials, the XLF, which is still trailing badly.

As for the Dow count, it still remains intact but has exceeded the normal level of retracement of 78.6%. The only rule for wave 2 is that it cannot exceed the beginning of wave (1) at 10,511. So the attached count remains valid until that level is broken, and offers a great risk/reward opportunity for the bears.

The dollar measured in the USD/CHF has formed a double top and reversed sharply and broke to a make a lower low beneath the 1.0385 level I mentioned in my last post which breaks the short term uptrend. So extreme caution is now warranted for short term dollar bulls as the dollar might have formed a short term top, and should reverse for the next several days. The long term trend for the US dollar is still up, so I will be looking to buy again when the USD/CHF gets into the 1.0175 - 1.0270 range, and for the EUR/USD I'd be looking to sell when it reaches the 1.4540 - 1.4700 range.

With the holiday season in full force now, and light trading in place, I'm not sure how often I'll be posting before the new year. If something of significance occurs I'll be back, otherwise enjoy the holidays with friends and family and remember that the markets are just a game, but good health and relationships with good friends and family are what's really important.

HAPPY HOLIDAYS!!

Monday, December 21, 2009

Dow 5 Wave Decline Intact, is the Dow Telling us a Top in Equities is in?


In my last post I illustrated a clear clean 5 wave decline in the Dow Industrials (click here to see that post for context). Other indices didn't follow suit last week though, and today we see why. The other major indices, especially the S&P, have made new highs yet the Dow has not, so this explains why the other indices did not decline in 5 waves like the Dow, it's because they were correcting and were going to charge to new highs, while the Dow has possibly topped and reversed. Observe the 15min Dow cash chart attached. It shows the 5 wave decline from last week and today's 3 wave rally right into the fibonacci retracement level of 78.6% where it reversed at. So this suggests the Dow has topped and is in a downtrend. If not, I'm easily proven wrong with just a few Dow points higher above the 10,511 level. So the risk/reward at this point is desirable for the bears.

The Dow was the leader higher a few weeks ago when other secondary indices were lagging, i.e. the Russell 2000 and XLF, so it's possible the Dow is telling us that it too has finally reversed trend. Regardless, as I said in Friday's post, because of the 5 wave drop in the Dow, any significant rally will bring a great risk/reward shorting opportunity for the bears. That opportunity has arrived as it currently is trading at 10,430 and one now short with a stop above the 10,511 level (the start of the 5 wave decline).

In addition to the Dow's wave structure, gold and silver appear to have topped. Observe the daily gold futures chart attached and notice the blowoff top and reversal, which is typical of major commodity tops, just look at oil's surge higher to $147 last year where it reversed to around the $30 range in short order afterwards.

Also, the dollar uptrend remains intact and the series of higher highs and higher lows remains solid. However it does seem to be trading a bit sideways at the moment and losing some steam, but that may just be its way of correcting itself. The uptrend momentum may be so strong that it will correct sideways to alleviate its overbought condition, instead of actually declining to alleviate the condition. As you can see in the USD/CHF chart attached, I'm placing the 1.0385 level as the key level for the short term uptrend to remain intact. A drop below there would break the series of higher lows, and therefore warn that a larger correction was occuring. But any significant drop in the dollar would just bring about a good opportunity for dollar bulls to start establishing new positions.

So the dollar has bottomed and reversed, commodities have topped and reversed, the XLF and Russell 2000 appear to have reversed, and now possibly the Dow has finally topped and reversed. Slowly but surely market after market is reversing. Eventually it will catch up to all equities, and the reversals in stocks will be just as fierce and relentless as that seen in the current precious metals decline and dollar rally. If 10,511 is broken in the Dow, it will invalidate the 5 wave drop and suggest that perhaps a final blowoff top in stocks is occuring if the upper end of the range is solidly broken. I'll deal with that occurance when it happens. But for now, my focus is on the dollar and the Dow's wave structure.


PLEASE NOTE: THIS IS JUST AN ANALYSIS BLOG AND IN NO WAY GUARANTEES OR IMPLIES ANY PROFIT OR GAIN. THE DATA HERE IS MERELY AN EXPRESSED OPINION. TRADE AT YOUR OWN RISK.

Friday, December 18, 2009

Dow Signaling a Break Lower Out of the Range Soon


The market rallied this morning, lofted by the good RIMM and Oracle earnings. But after the cartwheels and riverdancing stopped at this "great" news the market sold off to new lows. The S&P is not that clear right now as to the wave structure and is sporting a similar garbled look that it has the past several declines that have been eventually completely reversed. However the Dow Industrials tell us a different story.

As you can see from the attached Dow Industrials 15min chart, the index has traced out a 5 wave decline, telling us that the short term trend is down, and that 10,264 will be broken before 10,510 will be broken. What's interesting is that this 5 wave decline led right to the bottom of the Dow's lower range then bounced (see Dow daily chart). This may be significant because it means that after a wave 2 or B corrective rally occurs, the Dow will charge lower beneath 10,264, and probably much further towards at least the 10,100 area, breaking down the lower end of the range. The significance of breaking out of the range to the downside will be examined when it occurs. A strong rally in the Dow right now would be a great risk/reward opportunity for the bears to get short with a stop above the 10,510 level.

As you can also see from the Russell 2000 chart, it too has declined in 5 waves and rallied in 3. The top of wave 2 at 612.81 should cap any rally attempt and 600.96 should eventually be broken.

Also notice the dollar has continued to climb. The series of higher highs and lower lows is still intact, so the short term uptrend is still intact. I drew a trendline that appears to be holding the rally up in place so far. A close beneath that trendline will break the series of higher lows, and the level that has hoisted the rally so far, so it would hint that the short term rally was ending.

Thursday, December 17, 2009

Dollar Rally Smacks Precious Metals and Stocks


The dollar rallied hard yesterday through today putting great pressure on commodities and stocks. Gold and silver lost over 3% and equities tumbled on the stronger dollar; again showing the real fuel behind the stock market's rally and strength. When the dollar rallies, stocks buckle. As you can see from my previous post last night, the dollar has formed a major bottom and should rally for months. The stock market will have a very difficult time making new highs under these conditions. Let's look take a look at the charts I have this afternoon:

1) the daily S&P cash chart shows that yesterday the market again was repelled by the top-end of the range it's been trading in the past few weeks, suggesting that the bulls still don't have enough force to push it through to the upside to new highs. So now we must focus on the lower end of the range around 1085 and see if the bears can come in and take control. A close beneath 1085 would be a good sign that perhaps the range trading has broken to the downside.

2) the primary impulsive S&P count shown is my top choice for 3 reasons: 1. the dollar appears to have bottomed and precious metals have topped so a major stock market top may be at our feet right now; 2. the decline looks very impulsive and one of the strongest and most clear we've had in a while, and the wave (2) correction is quite shallow suggesting there is a lot of downside pressure to this decline instead of just the usual ABC decline; and 3. the fact that other indices are looking very toppish and have made solid closes to suggest their downtrends have resumed (i.e. Russell 2000 and XLF). Also, this is a great risk/reward opportunity for the bears. The count is wrong with a break above 1101, just 5 points higher from current levels, and the profit potential is huge.

3) the alternate S&P count chart shows the other possibility in that we are in an A-B-C corrective decline that will most likely be halted within the range above 1085 and then rally again towards 1120 and possibly higher.

4) gold and silver have sold off sharply, fitting well into the "blowoff top" scenario commodities usually undergo when making a major top, just like oil did into its $147 top before it reversed to around $30. Gold and silver should make similar moves to the downside now. The attached gold futures daily chart shows a triangle in the middle of the rally over the past several months. Triangles only occur in B, X and 4th waves. This is obviously not a 4th wave, and the entire rally looks a lot like a clear 3 wave rise, so it's probably a B wave. A break of the wave A high at 1010 will confrim that the rally was a 3 wave correction, and that 680 will be broken on the downside before a new high above 1220 is achieved.

5) the gold futures 10min chart is self-explanatory. I just wanted to show that it appears the next round of selling is underway as it appears to be declining impulsively since making a modest rally attempt this week. Look for gold to continue lower, capping any rally beneath the 1140 level.

6) the XLF is a very telling chart. This is the most bearish market I can see right now next to precious metals. While other markets were churning sideways or making slight new highs, the XLF was actually grinding lower. Following a clear 5 wave decline back in October, the financial sector has made a modest rally and then chopped lower, capping all rallies beneath a descending trendline. Today's close was on the lows, and is the lowest close since the wave 5 bottom back in October. This sector should continue downward with rallies capped beneath that blue descending trendline marked in the chart.

7) the Russell 2000 daily chart tells a similar story to the XLF. After its 5 wave decline in October it has failed to make a new high, and actually has SO FAR rallied in 3 waves. Breaking beneath the wave "a" high is a good start in confirming that the rally was in fact 3 waves - a correction, but a print beneath the wave "b" low will ultimately confirm it.

So there you have it, a lot of bearish action occured today leaving the possibility for a major market top and reversal to be underway right now. However we still have a long way to go before confirming it as we've seen this type of action fool us many times before. But the table is set for the market bears to take over if they're ready.

The key things to watch for in the coming days are:

1) as long as the dollar uptrend remains intact, the stock market will be biased to the downside.
2) gold, silver and all commodities have been a big part of the stock market's rally, so continued bearish action in this sector will also be very bearish for stocks.
3) watch for the XLF to make a new low beneath it's October low.
4) watch for the Russell 2000 to break its wave "b" low.

Any of these things occuring will strengthen the short term bearish case for the stock market. As always, I welcome all your questions and comments on recent action in the markets.


PLEASE NOTE: THIS IS JUST AN ANALYSIS BLOG AND IN NO WAY GUARANTEES OR IMPLIES ANY PROFIT OR GAIN. THE DATA HERE IS MERELY AN EXPRESSED OPINION. TRADE AT YOUR OWN RISK.

Wednesday, December 16, 2009

Asian Session Sparks US Dollar Short Covering Rally; S&P Futures Print 5 Wave Decline


The dollar spiked higher as we went into the Asian session following the Fed statement today. Perhaps the dollar shorts are getting a bit nervous now. This nervousness and short covering should be a contagious action that will build in momentum in a relentless spiral within itself, raising the dollar higher and higher for several months. Of course, with the short term wave count unclear, a snap back wave 2 type decline can occur any time though. But the evidence is quite strong that a significant US dollar bottom has formed, and surprises and the least resistance should be to the upside. Until the series of higher highs and higher lows is broken, the short term trend remains up. Any significant drop that stops me out will only have me looking to re-enter on the long side at a better price.

The dollar bullishness has put some pressure on the S&P futures tonight and has created a textbook EWP five wave impulsive decline as you can see from the attached chart. So it's possible the current decline may be the start of something bigger, but we'll have to see how the wave structure unfolds from here. The S&P bounced off the top of its range today, so with this 5 wave decline tonight it appears that at least in the very short term the trend is now down for the stock market.

So that's all for tonight. Just wanted to write a quick post on this interesting action I noticed.

Fed Statement Today; Dollar Uptrend Intact; Stock Market Still Consolidating


The market rally is coming to an end and the fractured nature of various markets is taking hold. First the financials left the rally as measured by the XLF, then the small cap stocks left the rally (Russell 2000), now with the dollar rally the commodities are leaving the rally as well. The core of the rally is getting thinner and thinner. It's like Alexander the Great charging up a hill with his army only to reach his enemy and turn around to see just a few troops behind him. Even Alexander would eventually retreat under these circumstances. But Alexander hasn't turned around yet. So we still have to wait. Or maybe someone can throw a rock at his head so we can get him to turn around and see how mad he his for still running up the hill :)

The key remains the dollar. The dollar rallied big against the Australian dollar last night, finally catching up to the other dollar pairs. The trend is clearly up for the dollar with constant higher highs and higher lows the past several days. I attached an extremely aggressive US dollar (using the USD/CHF) wave count. But this count does not instill high confident because whenever an elliotician has to count a move as a series of 1s and 2s, it usually means it's wrong. However, I cannot come up with another highly viable short term wave structure at this point, so I'll use this until it's invalidated. If correct, it will soon undergo a wave 3 at various degrees which essentially means a straight line up. Only a break of 1.0230 would invalidate this count. No matter how aggressive of trader I am, I would not short the dollar at all, I would only be looking to go long, on any timeframe.

As for the stock market; blog reader JD brought up a good point regarding the fractal nature of the market now and back into the March 2009 lows (see discussion here with JD, as well as with Rob regarding the dollar's impact lately). I attached charts illustrating their similarities. Last year we had a consolidation lasting about 4 months that eventually led to a sharp drop lower to new lows which was quickly reversed and never looked back into present day. Today we've had similar consolidation, and as I've said before I would not eliminate a "blowoff top" from occuring before the wave 2 or B top forms. If history repeats itself, only inversely, then we'll get a sharp rally from this range we're in now, targeting the 1200 S&P area which will lead us into a major top and reversal. If it occurs, the rally should be short lived and completely reversed quickly just as it did into the March lows inversely.

Trading Strategy: If someone were to be conservative, I would think the best strategy would be to wait to go short the S&P on a strong close beneath 1085, preferably closer to the 1075 level. If someone were moderately aggressive they could also possibly wait for a breakout rally out of the range and start shorting when a reversal occurs with a stop at the recently established high. This would probably take repeated attempts to catch the top, but once someone can catch one, the rewards should be big. If someone were very aggressive they could get long on any pullback with a stop loss just below 1085. So those are the possibilities I see at the moment to trade.

Remember, at 2:15pm EST, the Fed will issue its statement and there tends to be a lot of volatility in the markets surrounding this. So I recommend everyone double check their stops and limit orders are in place, and are the ones they still want in place. The actual Fed statement is not important to us ellioticians, what's important is the wave structure that surrounds the statement, and also the reaction in the following hours and days after the statement's released.

Good luck to everyone! I'll be back if something significant develops after the announcement.

Tuesday, December 15, 2009

Dollar Surges Higher; Stocks Remain Flat, Directionless


Yes, I did make up the word "directionless" from the title above. So what :) That's not important, what's important is the US dollar's continued surge higher. The rally appears a bit overbought and momentum waning but the dollar was so oversold and over-shorted on a long term basis that the current rally may be relentless, offering little opportunity to enter. I'm still cautious of a snap back decline in the dollar, but with such a significant change in trend to the upside, surprises will also be to the upside. The dollar strength will continue to put a lot of pressure on equities and make it difficult for them to sustain any kind of rally, if not outright make them fall off a cliff. Continue to watch the dollar rally, it is the stock market's biggest enemy.

The S&P appears to be finishing up a 5 wave advance, if it hasn't done so already. If so, it may mean its final rally has ended, or will at least correct a bit of the 5 wave rally. Tomorrow is the Fed announcement so some volatility later today and the rest of the week is highly possible as investors jockey for position around the fed statement. A sharp erradic rally in stocks would fit nicely into the "blowoff top" scenario I mentioned in earlier posts, so I'm watching for that. If that does occur, it would be a good signal that "the top" is probably forming and the rally will be quickly reversed. That final spike will be the market's last attempt to eliminate the last of the already severely battered bears before it tries to collapse without them.

So the bottom line is that the dollar rally is very bearish for stocks, and a continuation of the dollar's uptrend should lead to the stock market's top and reversal. With the consolidation of the past few weeks in the stock market, I wouldn't be surprised to see a sharp final rally into the wave 2 or B high that will be quickly reversed. The Fed statement tomorrow MAY be that catalyst. Above all else, I'm looking for reversal patterns and 5 wave declines to signal a top is in. Until then, I continue to be short term neutral the stock market.

My positioning remains the same as yesterday.

Monday, December 14, 2009

Waiting for Next Big Move...


The market didn't help me out much today in sending any signals as to where the market will move in the short term, however it does appear that the upside is the path of least resistance still.

The key in the stock market is the dollar, which the stock market should move opposite of. The dollar appears to have bottomed and is in the process of unfolding in a 5 wave sequence. It's tough to get a good count on the waves right now because wave 2 labeled in the attached 4hr US dollar/Swiss franc chart doesn't have a corresponding 4th wave of similar degree. Also, the last few days of trading appears be unfolding a series of 4th and 5th waves, but does not fit well into a completed EWP count at the moment. The next big move in the dollar should help clear this up and give us a better idea of where we're out in the short term. But it does appear that upside momentum is waning, so a corrective dollar decline would not be a surprise. But I would use any decline at this point as a buying opportunity. I'm bullish the dollar all around right now.

If the dollar pulls back, the stock market should continue to rally. Notice on the attached daily S&P cash chart that the infamous ascending trendline has been broken with all this choppy trading lately; just another sign of a significant waning of uptrend momentum. Oftentimes markets will retest the underside of an ascending trendline, after its been broken, before it starts the major portion of its downtrend. So we'll see how strong of a ceiling this trendline acts like. The underside of the trendline will be at about the 1130 area Tuesday.

So unfortunately there's not much more to report at this point, and we'll have to wait to get more decisive action from this market before getting a better idea of the short term trend. So I remain:

Stock Market
short term neutral
long term bearish

US Dollar
short term neutral (as I prepare for a pullback)
long term bullish,

Precious Metals
short term neutral
longer term bearish

Friday, December 11, 2009

Great Economic News Today!! Stocks Struggle, Nasdaq in the Red, Dollar Surges, Not Quite What You'd Expect...


Great economic news came out today on retail sales and consumer sentiment data that really blew away what economists estimated the numbers would be. So the Dow should be up 200 points right? The recovery is on track so it's Dow 30,000 in a few years right? Well the Dow has been trading up a meager 40 points all morning and the Nasdaqs have actually turned negative at this time with the XLF and Russell 2000 about to go red too. Why? It's all in the US dollar. The dollar rallied big this morning, which has put tremendous pressure on the stock market. Earlier this week I said in response to the stock market reversal and dollar strength after the great non-farm payroll numbers:

The stronger dollar and weaker commodity action is putting severe pressure on the stock market. This all started with the dollar rally after the good jobs report Friday. So if you follow financial news and feel it moves the market, then think about this: the stock market rallied primarily on dollar weakness as you can see from the inverse tight correlation to the US Dollar Index (DXY). This is all happening when the so-called "recovery" is getting its legs. Now a great jobs number comes out on Friday and the dollar rallies because investors fear the Fed will raise rates sooner than expected. This causes stocks to sell off. So the stock market is rising on the hopes that the recovery is on firm legs but sells off when things get too good because the Fed might raise rates. So if good news and a good recovery won't push the stock market higher, what will? Darned if it does and darned if it doesn't. The bulls are in a tough spot here. Click here for full post

Well today, similar action occurred. The retail sales and consumer sentiment numbers blasted estimates, coming out much better than expected. Yet the stock market is struggling to stay in the positive as a whole. Why? Because the dollar rallied again on this good news as you can see from my USD/CHF chart above. Most of the rally from the March 2009 lows have been on dollar weakness, so it was just that prices rose mostly on dollar weakness; not that any fundamental or intrinsic value in stocks occurred. So when the dollar reverses, so will the stock rally.

The dollar is surging hard against the euro and swiss franc, but isn't performing as well against the British pound and Australian dollar so I'd like to see to dollar make new highs against these other currencies soon. But as it stands now, the dollar bull run has resulted in commodity weakness; gold, silver and oil reversed sharply this morning; which will also put tremendous pressure on the stock market. So the market is set to fall on bad news, and struggle or fall on good news. Again, the bulls are in a tough spot here at this juncture. I spoke about this also earlier this week, click here to view that post.

With that said, on the 15 min S&P cash index chart attached you can see it traced out a 5 wave rally which was confirmed by the Dow, but not the Nasdaq Composite or Russell 2000. But with 5 waves up from the lows, caution is still warranted for the bears at this point. I'm still short term neutral (long term bearish) the stock market until we get solid evidence of a top, and I'm still short term and long term bullish the US dollar.

Thursday, December 10, 2009

Market Remains Range Bound; Gains From Here Should be Hard Faught, and Short Lived


The market shot higher out of the gate this morning, fell back a little bit, then traded sideways the rest of the day. It rallied shortly after my post yesterday (click here for yesterday's chart) which pointed out the weakening momentum behind the downtrend, and then continued to rally higher this morning. The Dow actually created an inverse head and shoulders pattern on the 5min chart as well. This rally occurred at the bottom portion of the range, telling us the market isn't ready to break out of it in a decisive manner yet. Usually consolidations, or triangles, occur as a pause in the previous trend before spiking one last time in line in the previous trend's direction. In this case, that direction would be up. So it would not be surprising at all if we see some follow-through with this rally in the coming days, and probably get a spike to a new high on the year in the S&P cash index above 1119.

However with so many divergences in other indices and sectors, and the fact that even the euro didn't rally with the stock market today and precious metals continue to weaken, it tells me that any further rallying to new highs will probably be by the S&P, Dow and maybe the Nasdaqs all by themselves. The amount of indices, sectors and markets, charging higher to new highs is getting smaller and smaller. So any spike above 1119 in the S&P should be short lived, and worse case for the bears would be that it does a "blow off top" like gold did. But the reversal from that top will be just as fierce as the climb higher was.

So I remain short term neutral on the stock market and long term bearish. A solid close beneath 1085 will open the door to possibly a major top being in place, while a break above 1119 should be short lived and reversed shortly after.

Wednesday, December 9, 2009

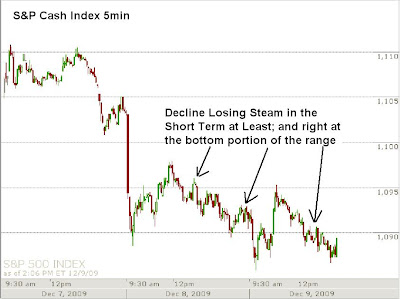
Decline Weakening Short Term and at the Bottom of the Range; Decision Time for the Market


Precious metals continue to sell off hard, but the US dollar is having trouble maintaining its upward momentum and the stock market is looking very "bottomish" as its past two declines have been very choppy and hard faught as seen on the S&P 5min chart attached. This "bottomish" behavior is exemplified by the fact that the S&P is right at the bottom portion of the range its been trading in the past few weeks. So the door is open for a sharp rally from current levels, however it's not required.

So it's decision time for the market. A solid break and close beneath that range, around 1085, should lead to acceleration of the downtrend and possibly align the stock market with precious metals, the Russell 2000 and the XLF by forming a major top. OR, it will bounce off the support and rally within the range further torturing the bears.

I remain neutral the stock market in the short term until the range is broken significantly.

Tuesday, December 8, 2009

Stock Market in a Range, but Bearish Commodities and Bullish Dollar Will put Downside Pressure on it


The stock market was very weak today with internals registering 2.24 down stocks on the NYSE for every 1 stock trading up, and 82% of all NYSE volume to the downside. The stronger dollar and weaker commodity action is putting severe pressure on the stock market. This all started with the dollar rally after the good jobs report Friday. So if you follow financial news and feel it moves the market, then think about this: the stock market rallied primarily on dollar weakness as you can see from the inverse tight correlation to the US Dollar Index (DXY). This is all happening when the so-called "recovery" is getting its legs. Now a great jobs number comes out on Friday and the dollar rallies because investors fear the Fed will raise rates sooner than expected. This causes stocks to sell off. So the stock market is rising on the hopes that the recovery is on firm legs but sells off when things get too good because the Fed might raise rates. So if good news and a good recovery won't push the stock market higher, what will? Darned if it does and darned if it doesn't. The bulls are in a tough spot here.

In the short term this is irrelevant. But what my point is-is that it's primarily dollar weakness that fueled the stock market higher from the March 2009 lows. With a weaker dollar, stock prices, not values, rose. The weaker a dollar is worth the more dollars it will then take to buy the same stock a few days ago. So the real story is the US dollar here. And it appears that it has formed a major bottom.

My attached S&P cash index daily chart shows the S&P in a range. Until that range is broken significantly and closed outside of, then we'll assume we'll be bouncing around here for a while. But with commodities topping and the dollar bottoming, the evidence is building that the breakout of that range will be to the downside, and perhaps soon.

Now look at the daily USD/CHF chart attached and notice the strong surge higher after several weeks of bullish divergence on the RSI. The last several weeks of the dollar's decline was not only very very crowded, but also had severely weakening momentum with every new low during that time as you can see from the RSI which failed to make new lows with price. Now the shorts are getting scared and covering their butts. The more the dollar rallies, the more shorts will get "squeezed" out of their positions. As crowded as this trade is, it would not be surprising if it just kept rising more and more with little break.

The last two attached charts are of gold. You can see on the intraday chart that gold has been massacred after its huge surge near the $1,230 level late last week. As commodities often do, it appears gold made a blowoff top and is now reversing just as sharply as it rallied. The count remains valid and gold should move inverse the dollar just as fast.

So I'm short term bearish gold and silver; short term and long term bullish the US dollar; and neutral on the stock market until we get a clean breakout from its range.

Meredith Whitney; Big Financials Bear

For those of you out there that like the fundamental side of trading/investing, here's a video from CNBC with Meredith Whitney who has been stellar the past couple years in identifying strenghts and weaknesses in various individual financial stocks, and financials as a whole. What she is saying here in this interview is one of the many reasons I'm short the XLF, and have been for a while.

The market sold off today but so far has no follow through. It's possible to count the decline from the highs of the year as impulsive, but probably needs to subdivide one more time to a new low to be perfect. Once structure unfolds more and makes things clearer, I'll post my opinion of the short term direction and key levels to watch for. I remain neutral in the short term for now, but a break of 1084 in the S&P cash would get my attention for the bearish side.


Monday, December 7, 2009

US Dollar is Key, Precious Metals Probably Topped, Stock Market Should Follow Soon


Just a quick update this morning on a few things I think are significant. As I've said many times, the US dollar is key to the stock market's movement. A dollar bottom and rally should result in a stock market top and reversal. You can see from my primary wave count on the attached chart of the 4hr USD/CHF that it's possible to count the rally from the lows as impulsive. But as you can also see from my alternate count chart below it is that it's also possible to count the rally as just an A-B-C correction which will most likely lead to lower prices soon. This should clear up as time goes by and wave structure unfolds. But now that we have the two top wave counts, we can watch the action from now on and see what fits best. The bullish count does remain my primary count right now though.

The reason the bullish dollar count is my primary count though is because of the action in precious metals. Gold has been in a blowoff top for a few weeks now but appears to have made its top. Last Friday, and halfway into today's US session, gold has dropped $83, or 6.8%. You can also see from my attached gold futures weekly chart that in addition to this, gold made a bearish weekly reversal candlestick. If gold topped, it will be hard for the dollar to make a new low, which means the current dollar count should be bullish as of right now.

The stock market is struggling to find direction, but the indications in the US dollar, precious metals, and several of the smaller indices indicate that a major top is forming and can give way at any time to a major sell off. Until the stock market gives us clear signs of that top occuring, I have to remain neutral in the short term, and of course I'm still very bearish in the long term.

Friday, December 4, 2009

Observe the Power of the Dollar on the Stock Market


It looks like yesterday's late day sell off was just profit taking and protective posturing for the jobs number that came out today because the major indices rallied to new highs and the Nasdaq confirmed the Dow and S&P's highs from yesterday, which eliminates the short term bearish non-confirmation. The longer term divergences remain in solid place.

Today's better than expected jobs numbers has everyone doing cartwheels on TV about the economy and the stock market. However the dollar has rallied sharply this morning as you can see from the AUD/USD and EUR/USD charts attached which move opposite the dollar. The stock market rallied huge this morning but so did the dollar. The stock market's rally could not fight the huge headwinds that a dollar rally brings, mainly because most of the rally from the March 2009 bottom was due to dollar weakness to begin with. It was just an inflationary rally in prices, not a fundamental underpinning of strength in the market. So the Dow went from a strong triple digit gain this morning to negative territory where it sits today.

I, and many others, have been saying for a long time that the key to the stock market's rally and decline is the dollar. A dollar rally will result in a stock market decline, and vice-versa. If today's reversal holds, we'll see if it has legs and runs next week. But the fact that people sold good news and the dollar rallied on a great jobs report is definitely bearish, especially because the past several months have brought rallying on jobs report day. A change in recent trends are another sign of a top, and today we have another piece of evidence supporting that.


PLEASE NOTE: THIS IS JUST AN ANALYSIS BLOG AND IN NO WAY GUARANTEES OR IMPLIES ANY PROFIT OR GAIN. THE DATA HERE IS MERELY AN EXPRESSED OPINION. TRADE AT YOUR OWN RISK.

Thursday, December 3, 2009

Markets Fractured and Sloppy, on Many Levels, Among Various Indices/Sectors


I have a lot of charts and comparisons to go over and I'll try to do my best conveying my message with out it getting all "spaghettied" and confusing. The bottom line is that the markets are very fractured in the larger timeframes (daily), and now they are showing a fractured structure on the smaller timeframes too. The market is not healthy, and the underlying fracturing is weakening the market, despite the window dressing new highs in the Dow and S&P lately.

First, let's look at the top chart which shows an updated 2 hour chart of the Australian dollar vs. the US dollar (AUD/USD). Today's rally carried to the 100% retracement level of the start of wave 1 exactly at 0.9321. This is the absolute maximum retracement for a wave 2. So the count posted yesterday and today remains valid. The reason this is of importance is because this pair moves fairly inverse to the US dollar, and is sporting a clearer EWP structure and wave count that other pairs that better follow the dollar, like the USD/CHF and the EUR/USD. When the AUD/USD and EUR/USD top, the stock market should top as well. The pair cannot rally above today's high, and should be in for a wave 3 of (3), which means it should collapse very soon in a fast and ferocious manner for the count to be correct.

Second, look at the financials ETF (XLF) daily chart. You can see the financials topped in mid-October, even though the Dow and S&P have kept charging higher to new highs since then. The XLF is lagging drastically, along with the Russell 2000, showing the inter-market divergence and strucutural weakness in the overall market I've been discussing for the past few weeks. You can also see that the XLF made a nice clean 5 wave decline from the high, then rallied in a 3 wave a-b-c structure I labeled wave (2). After some consolidation, most likely a series of small 1 and 2 waves, we got a big 2% sell off today. That fits well into the wave count which calls for a wave 3 at various degress to occur soon, which basically means an almost straight line down. So this count too remains on track, and very short term bearish, along with the Russell 2000.

Third, look at the daily chart comparisons of the Nasdaq 100 (left) and the S&P 500 (right). Click on the charts to enlarge. You can see that the Nasdaq 100, and the Composite (not shown), failed to confirm the new high the S&P and Dow (not shown) made on a daily basis. this is just more fracturing now occuring on various levels with various indices. This evidence, combined with a strong selloff today is very bearish.

Fourth, this last illustration is a good example of how bearish a non-confirmation can be when other markets, indices, or sectors do not confirm new highs. They are 15 minute charts of the Dow (left) and S&P (right). Click on the bottom charts to enlarge. The S&P shot to a new daily high while the Dow failed to confirm it. The result was a sharp sell off into the close today. Now this is just an intraday divergence among two indices. Just imagine how much stronger a decline will be when several indices and sectors on the daily charts are diverging, just like what is occuring now, and decide to finally sell off. Big decline ahead.

Today's action is encouraging for the bears as it is evident the market is looking for a reason to extend an overextended market higher and is having trouble finding it as it's been having trouble making any significant gains the past several weeks. However the bears have not been able to gain control of the market on downturns either. Until the bears arise in strength, which will be illustrated with a high volume day and consecutive selloffs, the market probably won't be able to tank in wave 3 or C. I suspect that people were selling today to reduce their exposure to stocks ahead of the big jobs number being reported early tomorrow morning. Lately, people have bought the dips when the jobs numbers were reported, so a break of that trend would be a good start for the bears. A big down day tomorrow may be very telling and would be encouraging for the hungry bears looking for a major top to gobble up.

So I remain short term neutral at this time with a slight bearish bias heading into tomorrows session. A big sell off tomorrow on big volume and weak internals will be a big sign that the prior trend of market action is breaking, and that perhaps a major top is in. Tomorrow's action should be very telling.


PLEASE NOTE: THIS IS JUST AN ANALYSIS BLOG AND IN NO WAY GUARANTEES OR IMPLIES ANY PROFIT OR GAIN. THE DATA HERE IS MERELY AN EXPRESSED OPINION. TRADE AT YOUR OWN RISK.

StatCounter